dang-bars
Welcome!
This page contains experiments with D3, Angular, and Pelican.
Let's start with a simple Angular.js Hello World:
Single Bar Chart: Directive
The following example shows a simple bar chart that is implemented as an
Angular.js directive. This makes it possible to use HTML code like <bar-chart></bar-chart>
and have it translated into Javascript code that assembles the data and
builds the D3 bar chart.

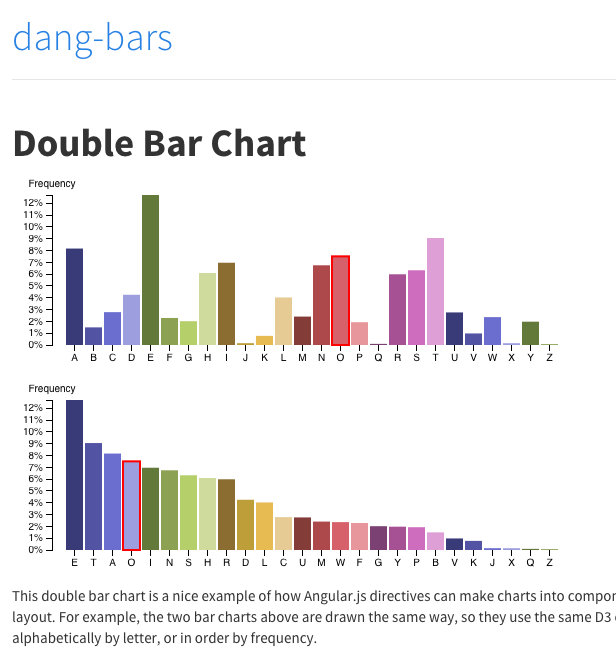
Double Bar Chart: Directive
And now a double-chart that re-uses the same directive with an option to sort the data or not.
This double-chart demonstrates how Angular.js directives can be re-used, and further, how options can be added to the directives to make it possible to re-use directive code to construct several different plots.
These charts also share a selection, via a variable managed by the controller that instantiates both charts. This allows the charts to share the selected point without having to interact with each other or create interfaces for each other.
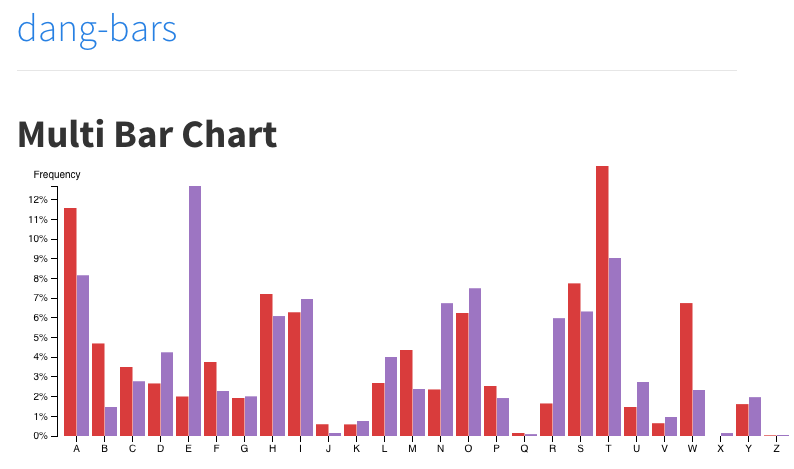
Multi Bar Chart: Directive
The following bar chart is a multi-series bar chart, demonstrating how to plot multiple x-y relationships on a single bar chart. This multi-series bar chart is drawn using an Angular.js directive.
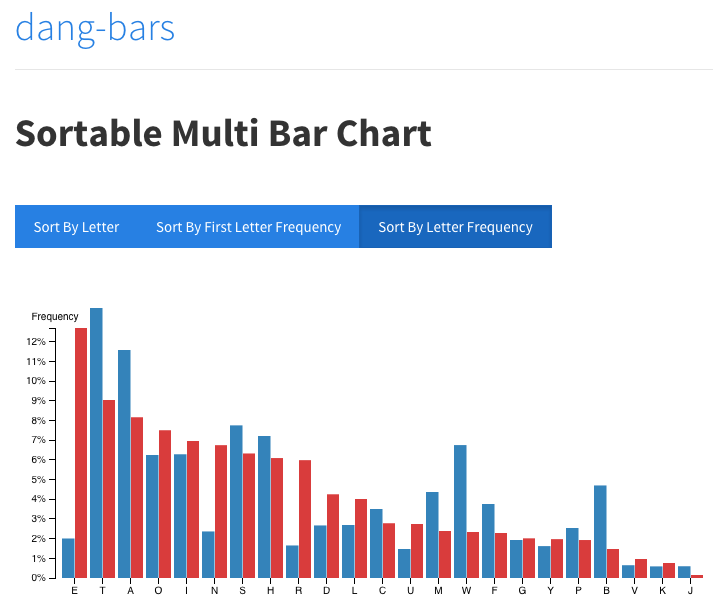
This example adds a button group that allows the user to sort the data. Each time the data is re-sorted, the bar chart is re-drawn. This is possibLe using the variable watch functionality built into Angular.js.
Animated Bar Charts
These examples demonstrate the use of animation for bar chart transitions. The first animation example modifies the sortable bar chart example from above, but animates the sorting of the bars.
