charlesreid1.com blog

Charlesreid1.com Stack

Posted in Charlesreid1

permalink

This post is a preview of a series of posts to come, which will document the process of containerizing the entire charlesreid1.com website.

We will run through a lot of different moving parts and how to get them all working:

  • Multiple domains and subdomains pointing to different services
  • Docker pod for all services
  • Nginx + SSL
  • Reverse proxies via nginx
  • Apache + MySQL + MediaWiki
  • phpMyAdmin
  • Gitea
  • Configuration files under version control
  • Data managed with backup/restore scripts and cron jobs
  • Static content under version control
  • Files server
  • REST API
  • Management LAN

All of the code for doing this is in docker/pod-charlesreid1, in particular in the docker-compose.yml file.

The big switchover took nearly a month, but it was relatively seamless, and only required one false start and a few minutes of downtime.

For now, check out the readme at docker/pod-charlesreid1. More details to come.

Tags:    web    git    pelican    nginx    ssl    apache    mediawiki    javascript    php    docker    security   

D3 Calendar Visualizations

Posted in Javascript

permalink

Table of Contents


Starting example

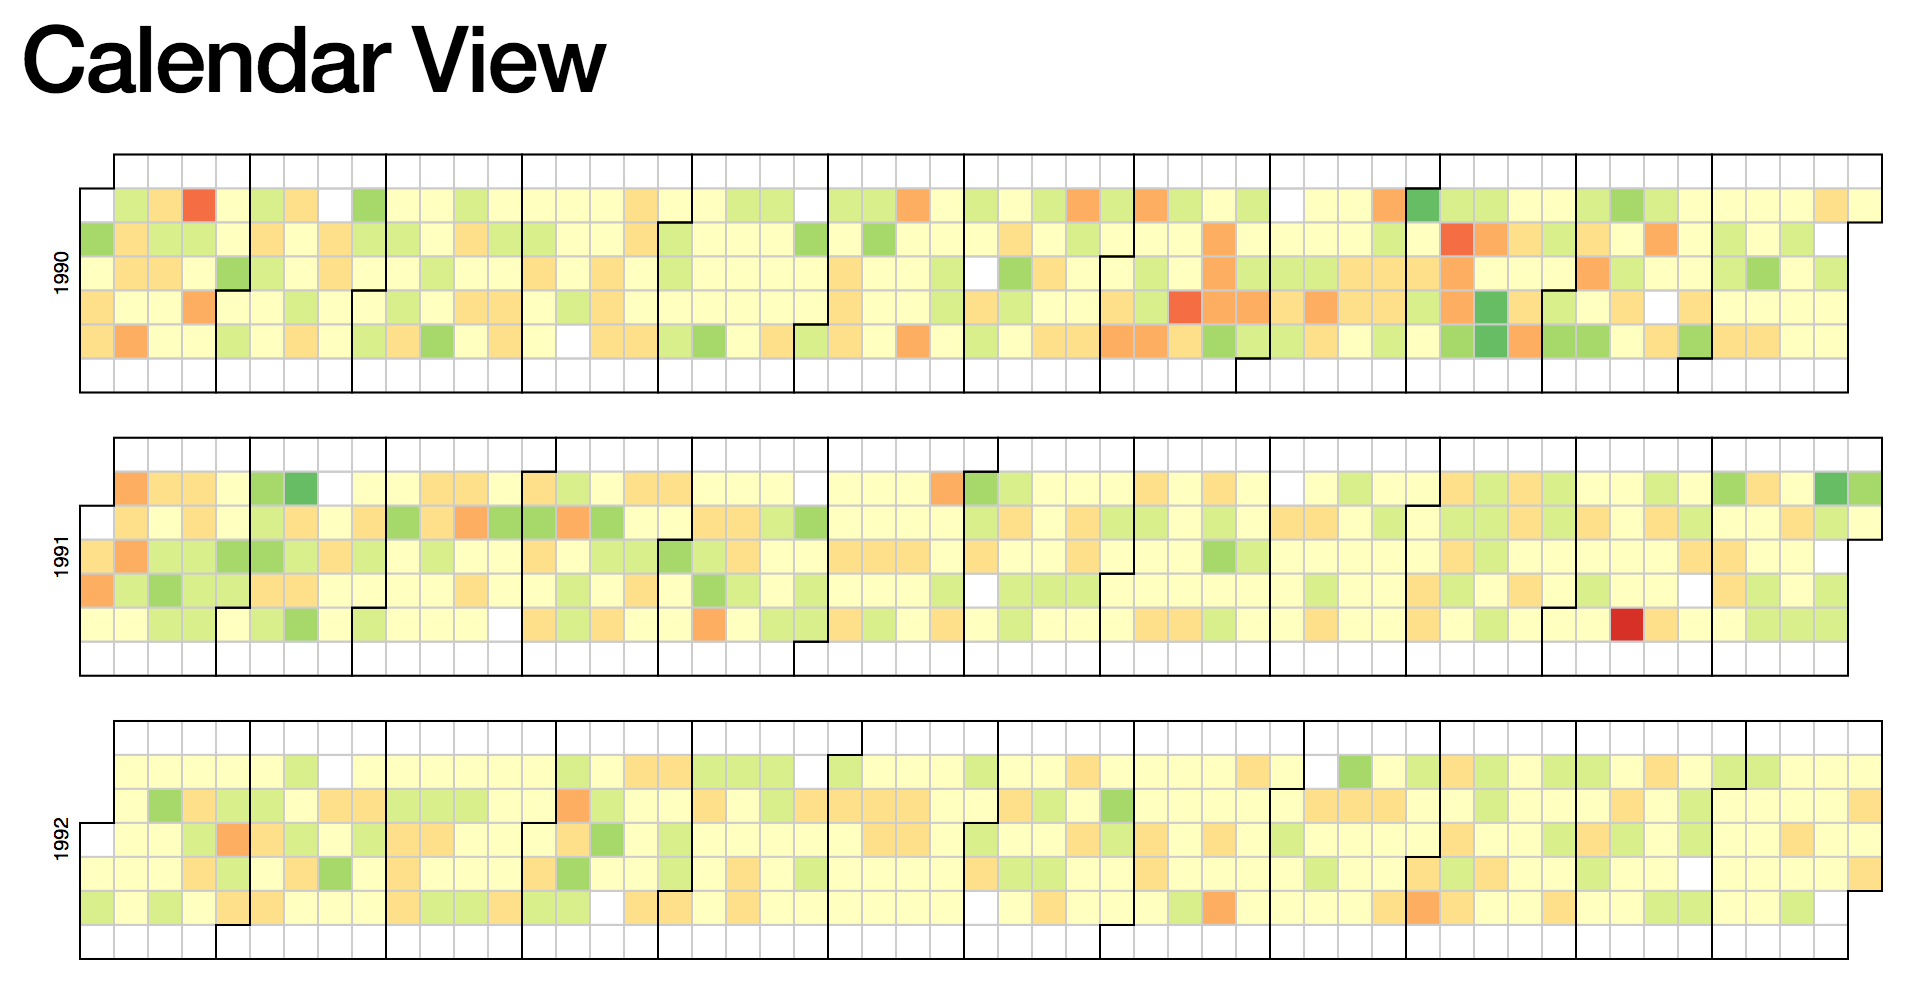
Let's begin with a D3 example. Mike Bostock provided a Calendar View block illustrating how to draw a very interesting visualization of large amounts of data over time:

You might recognize this type of graph from Github, whose activity graph shows the same visualization.

The data shown in this example consists of several years of stock market data. It is a simple but very large data set, with each data poit consisting of one date and one number (the percentage gain or loss).

The example also shows how to perform a simple calculation from multiple fields of the data to plot a derived quantity. In this case, the data consists of a high, low, and close, and the quantity being plotted is the percent change:

$$ \mbox{% Change} = \dfrac{\mbox{Close} - \mbox{Open} }{\mbox{Open}} $$

What needs to be changed

To change this calendar visualization to visualize our own data, we need to change two things:

  • The data set being visualized
  • The color map being used

We can leave the rest alone, or make small modifications as needed. Fortunately, these changes are straightforward to make for the calendar visualization.

Formatting the data

To modify the calendar graph for our own data, we'll output data as a time series: one column of date/time stamps, and another column of data to plot.

Let's take a look at the original data:

Date,Open,High,Low,Close,Volume,Adj Close
2010-10-01,10789.72,10907.41,10759.14,10829.68,4298910000,10829.68
2010-09-30,10835.96,10960.99,10732.27,10788.05,4284160000,10788.05
2010-09-29,10857.98,10901.96,10759.75,10835.28,3990280000,10835.28
2010-09-28,10809.85,10905.44,10714.03,10858.14,4025840000,10858.14
2010-09-27,10860.03,10902.52,10776.44,10812.04,3587860000,10812.04

In the code, we can see where this data is actually being parsed:

  var data = d3.nest()
      .key(function(d) { return d.Date; })
      .rollup(function(d) { return (d[0].Close - d[0].Open) / d[0].Open; })
      .object(csv);

So, to modify this to suit our own custom data set, we can output our data as:

date,series1series2
2010-10-01,1,150
2010-10-02,2,250
2010-10-03,3,350

and change the data parsing code to:

  var data = d3.nest()
      .key(function(d) { return d.date; })
      .rollup(function(d) { 
            // Change this depending on what you want to plot
            return d[0].series1; 
      })
      .object(csv);

Next, we discuss a few interesting applications of this visualization technique and how to generate the data sets.

MediaWiki Edits

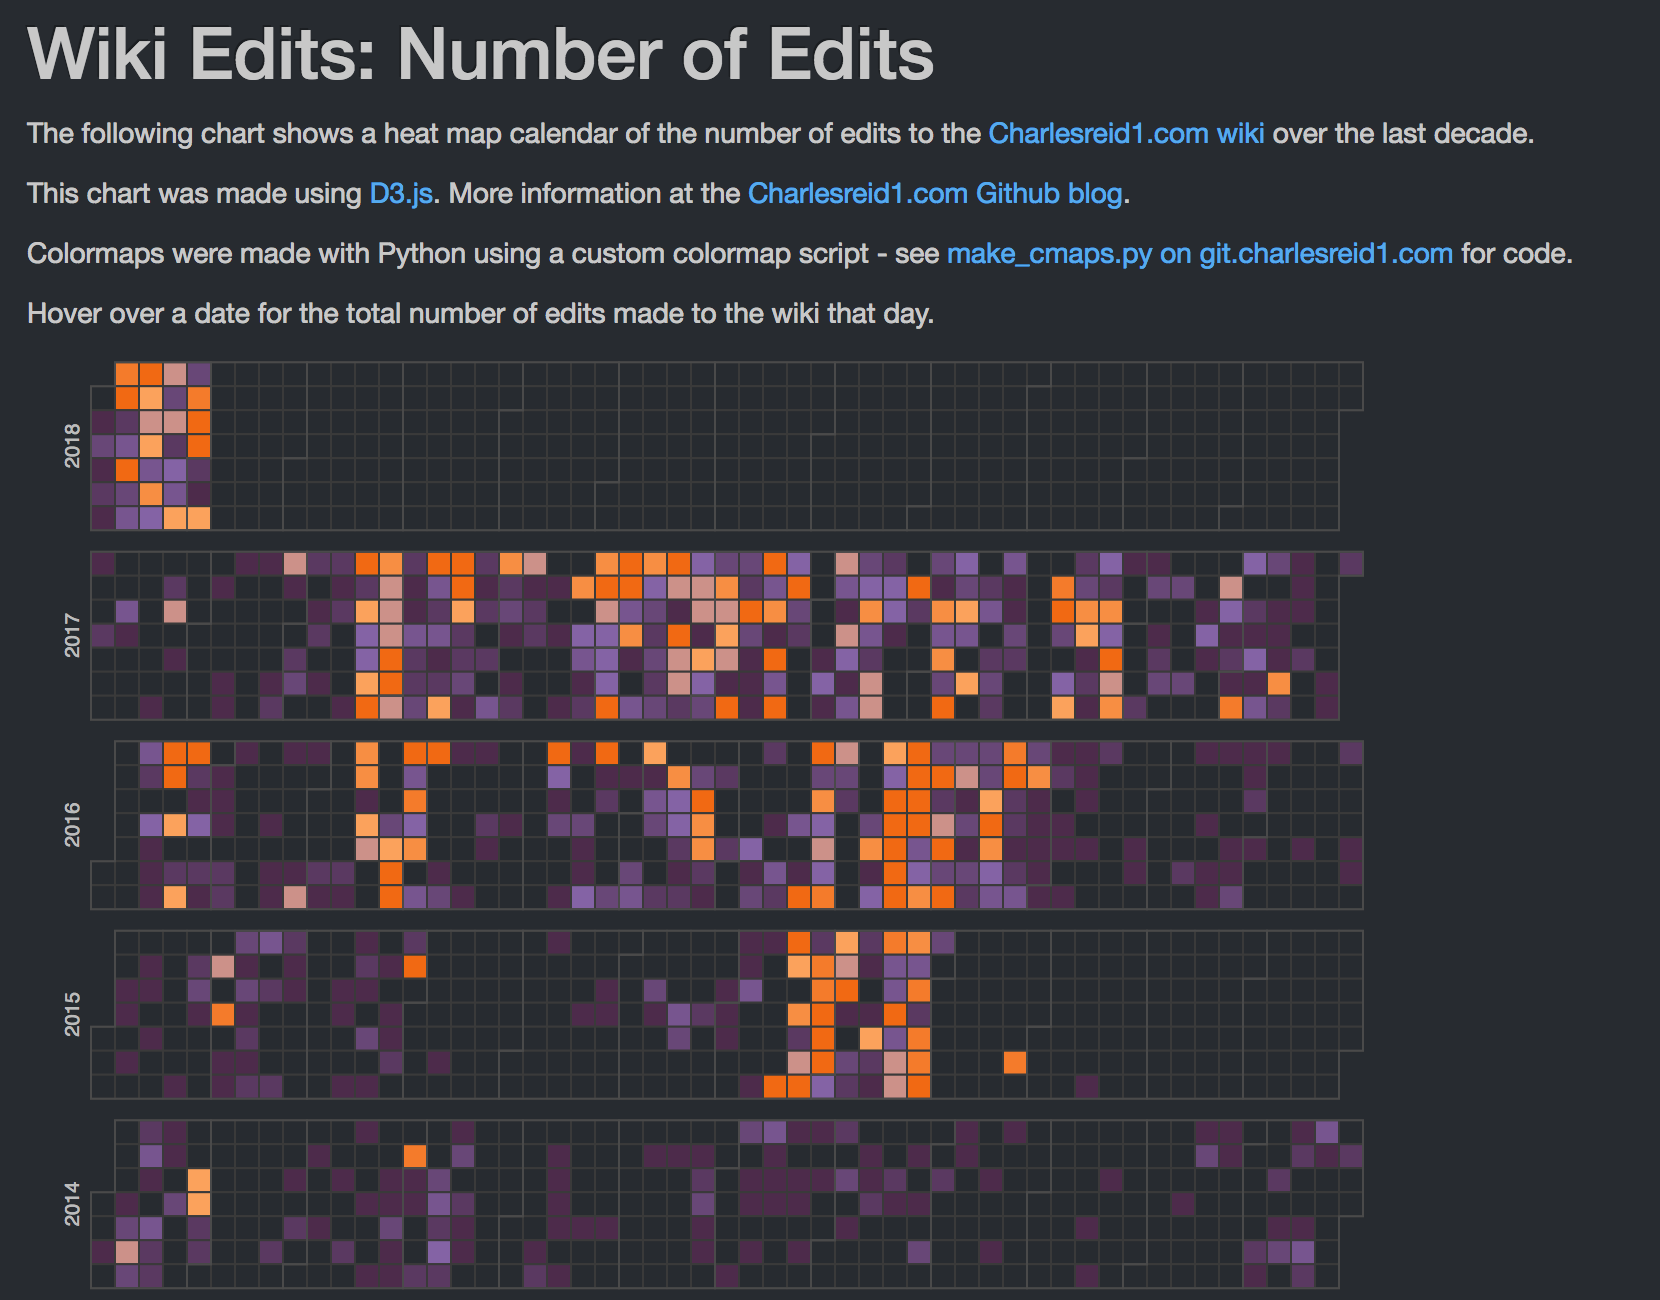
One of the applications of interest was scraping a MediaWiki wiki (charlesreid1.com/wiki to be precise) to determine the number of edits made to the wiki on a given date.

Fortunately, MediaWiki provides a rich API for interacting with wikis programmatically, and one of the best packages for doing it is pywikibot.

The way we compiled the data set for visualization was to scrape page histories for every page on the wiki, creating one observation for each edit on each page, and agglomerate the edits for each day into a final count.

The schema used was:

  • _id - sha1 of text
  • title - title of article
  • timestamp - timestamp of edit
  • count - number of characters in edit

The pseudocode used to extract the page edits was:

    get pages generator
    for page in pages:
        get page revisions generator
        for revision in page revisions:
            drop old doc from database
            insert new doc into database
            update record 

Finally, a bit of pywikibot code:

    # Get the site
    site = get_site()

    # Get the iterator returning pages to process
    page_generator = get_page_generator(site, N)

    # Run the algorithm:
    for page in page_generator:

        page_title = page.title()

        print("Now parsing page: %s"%(page_title))

        rev_generator = page.revisions(content=count_chars)

        for rev in rev_generator:

            # Assemble the NoSQL document
            doc = {}
            doc['_id'] = rev.sha1
            doc['title'] = page_title
            doc['timestamp'] = rev.timestamp
            doc['count'] = len(rev.text)

            # Insert the new NoSQL document
            page_history_collection.insert_one(doc)

The mechanisms to obtain the page generator

def get_site():
    """Get the Site object representing charlesreid1.com
    """
    return pywikibot.Site()

def get_page_generator(s,max_items=0):
    """Get the generator that returns the Page objects 
    that we're interested in, from Site s.
    """
    page_generator = s.allpages()
    if(max_items>0):
        page_generator.set_maximum_items(max_items)
    return page_generator

Note that pywikibot will already have the site configured once you run the login script. For more information about how to log in to a wiki with Pybot, and general information about Pywikibot tasks, see the Pywikibot page on the charlesreid1.com wiki.

Git Commits

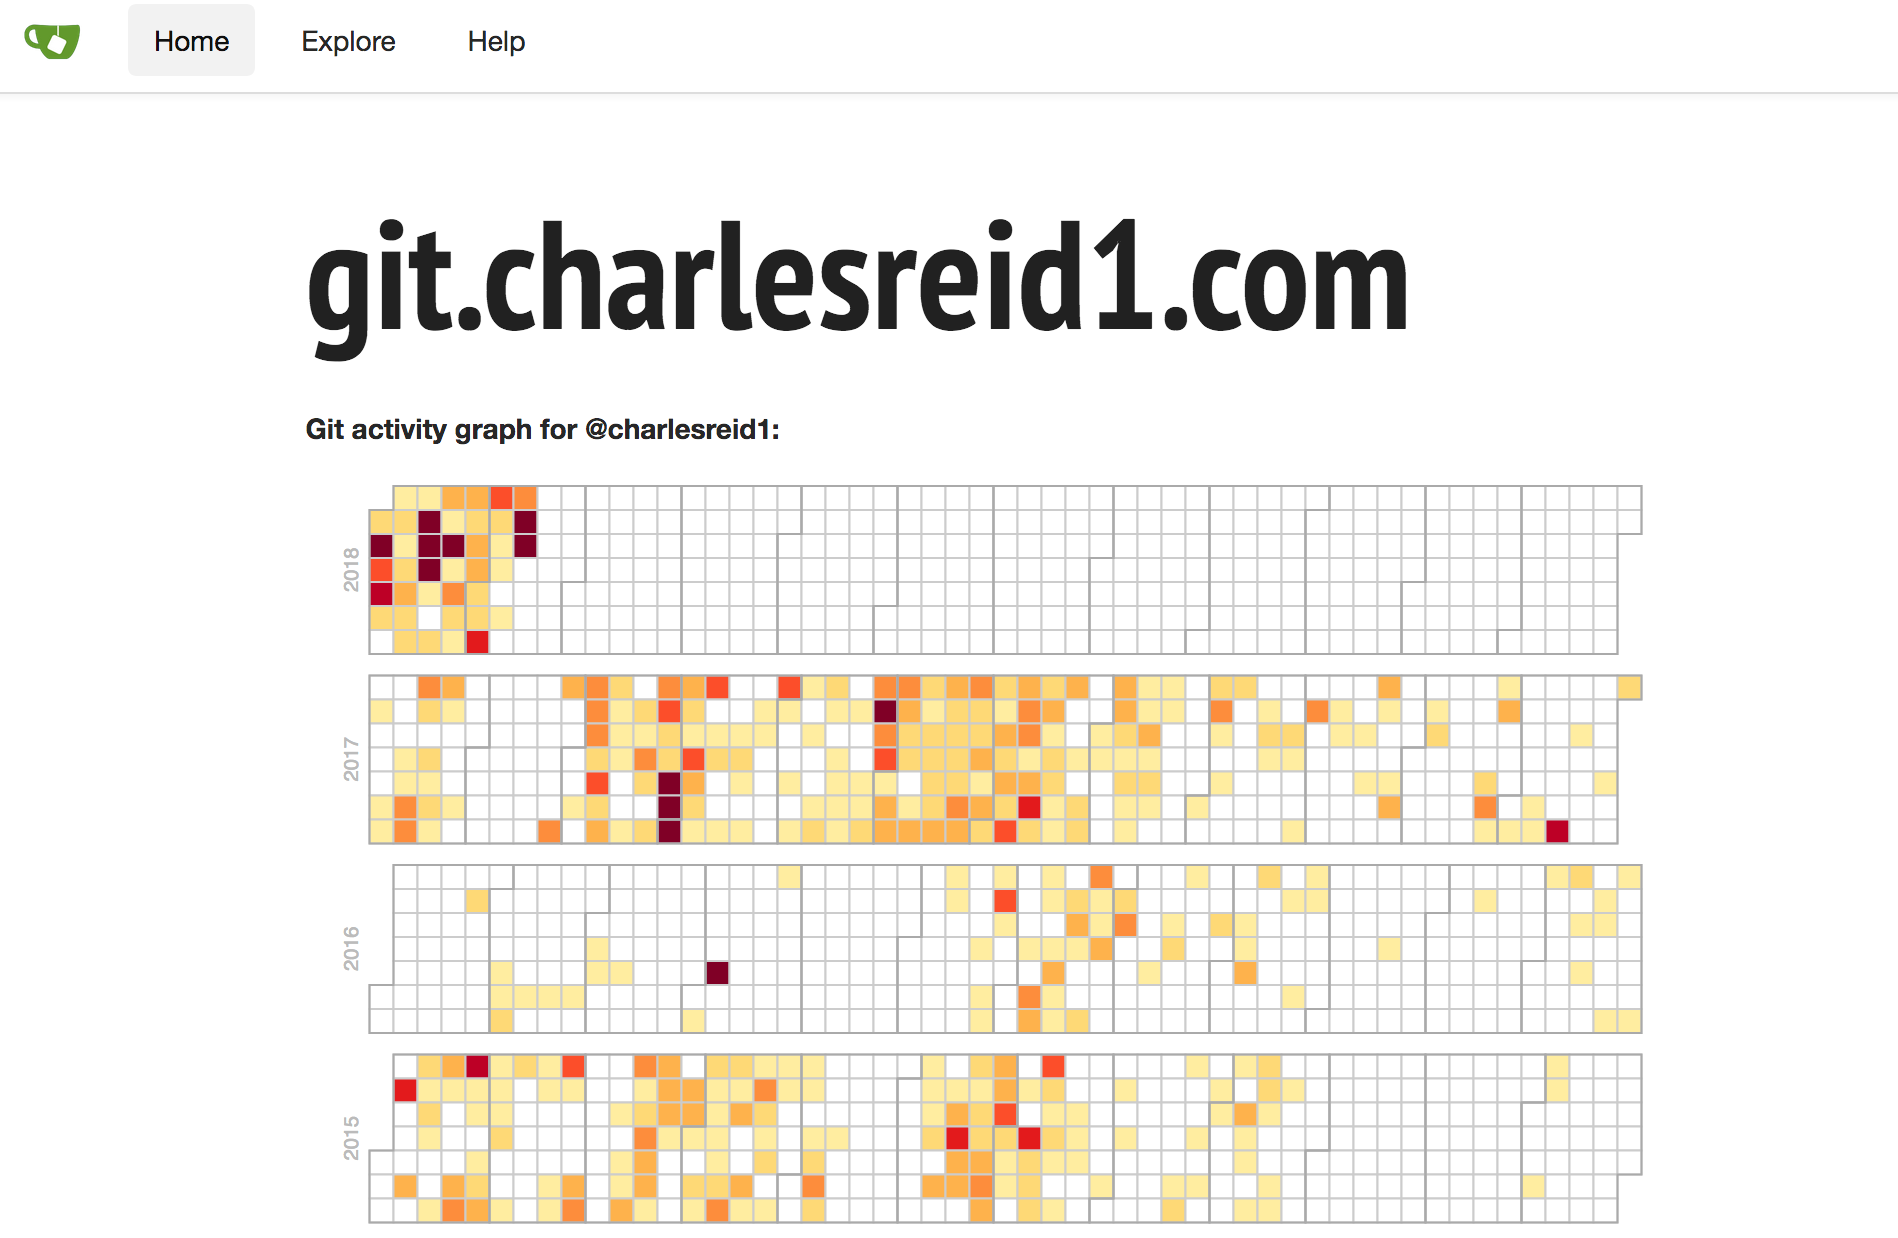
Another application of these types of calendars comes directly from Github's visualization of the number of commits made by a user on each day.

To extract this information, you will need a folder full of git repositories, which will allow you to use git status to extract commit information from the log of each repository and assemble it all into a time series for a calendar.

While there is a Python package for interfacing with the git API, git itself is extremely powerful and is capable of doing this just fine. We use Python's subprocess library to make a call to git status, and parse the results into a data structure for exporting to CSV.

Here is the code that was used to walk through each directory and extract information from a git status command:

import subprocess
from glob import glob
import os, re
import pandas as pd
import datetime


[clipped]


    df = pd.DataFrame()
    orgs = glob(root_dir+"/repositories/*")
    for org in orgs:
        base_org = os.path.basename(org)
        repos = glob(org+"/*")
        for repo in repos:

            # Print out the org and repo name
            base_repo = re.sub('.git','', os.path.basename(repo))
            log_file = base_org + "." + base_repo + ".log"
            print("%s : %s"%(base_org,base_repo))

            # Get each commit
            with open(status_dir + "/" + log_file, 'r', encoding="ISO-8859-1") as f:
                lines = f.readlines()

            for line in lines:
                tokens = line.split(" ")
                commit_id = tokens[0]
                date = tokens[1]
                time = tokens[2]
                msg = tokens[4:]

                df = df.append( 
                                dict(   
                                        commit_id = tokens[0],
                                        date = tokens[1],
                                        time = tokens[2],
                                        commits = 1,
                                        msg = " ".join(msg)
                                     ),
                                ignore_index=True
                                )

    ag = df.groupby(['date']).agg({'commits':sum})
    ag['commits'] = ag['commits'].apply(int)
    ag.to_csv('commit_counts.csv')

The last bit of code groups each commit by date, applying the sum function to the number of commits (1 for each commit), to yield the total number of commits for each date:

date,commits
2014-01-17,2
2014-03-26,11
2014-03-28,3
2014-04-01,4
2014-04-02,10
2014-04-03,4
2014-04-04,3

Creating the color map

The best part of the process is picking a color map for the calendar. The ColorBrewer site has some good color palettes inspired by cartographic color needs. Python also provides some useful libraries and functionality for generating colormaps.

There are a number of options:

Here, we'll cover an alternative approach: defining a colormap that linearly interpolates between colors at particular locations on the interval 0 to 1.

We will also use the webcolors module in Python to convert between colors in various formats, and a function make_cmap() available from Chris Slocum:

Link to make_cmap.py

make_cmap.py:

def make_cmap(colors, position=None, bit=False):
    '''
    make_cmap takes a list of tuples which contain RGB values. The RGB
    values may either be in 8-bit [0 to 255] (in which bit must be set to
    True when called) or arithmetic [0 to 1] (default). make_cmap returns
    a cmap with equally spaced colors.
    Arrange your tuples so that the first color is the lowest value for the
    colorbar and the last is the highest.
    position contains values from 0 to 1 to dictate the location of each color.
    '''
    import matplotlib as mpl
    import numpy as np
    bit_rgb = np.linspace(0,1,256)
    if position == None:
        position = np.linspace(0,1,len(colors))
    else:
        if len(position) != len(colors):
            sys.exit("position length must be the same as colors")
        elif position[0] != 0 or position[-1] != 1:
            sys.exit("position must start with 0 and end with 1")
    if bit:
        for i in range(len(colors)):
            colors[i] = (bit_rgb[colors[i][0]],
                         bit_rgb[colors[i][1]],
                         bit_rgb[colors[i][2]])
    cdict = {'red':[], 'green':[], 'blue':[]}
    for pos, color in zip(position, colors):
        cdict['red'].append((pos, color[0], color[0]))
        cdict['green'].append((pos, color[1], color[1]))
        cdict['blue'].append((pos, color[2], color[2]))

    cmap = mpl.colors.LinearSegmentedColormap('my_colormap',cdict,256)
    return cmap

Now, an example of how we can call this function: this code creates a colormap ranging from purple to orange.

def purple_to_orange():
    """Dark purple to bright orange."""

    start_hex = "#4d2b4b"
    mid1_hex  = "#8c6bb1"
    mid2_hex  = "#fdae6b"
    end_hex   = "#f16913"

    start_color = [j/255 for j in webcolors.hex_to_rgb(start_hex)]
    mid1_color   = [j/255 for j in webcolors.hex_to_rgb(mid1_hex)]
    mid2_color   = [j/255 for j in webcolors.hex_to_rgb(mid2_hex)]
    end_color   = [j/255 for j in webcolors.hex_to_rgb(end_hex)]

    colors = [start_color, mid1_color, mid2_color, end_color]
    position = [0, 0.5, 0.6, 1]
    cm = make_cmap(colors, position=position)

Now, the following code will evaluate the colormap to create 9 separate hex colors:

    # Now just call cm(0.0) thru cm(1.0)
    N = 9
    hex_colorz = []
    for i in range(N+1):
        x = i/N
        rgbd_color = cm(x)[0:3]
        rgb_color = [int(c*255) for c in rgbd_color]
        hex_color = webcolors.rgb_to_hex(rgb_color)
        hex_colorz.append(hex_color)

    print(hex_colorz)

How the calendar code works

Start with the HTML document:

<!DOCTYPE html>
<body style="background: #272b30;">
<div id="calendar"></div>
<script src="https://d3js.org/d3.v4.min.js"></script>
<script>
/* D3 code goes here */
</script>
</body>

Next, the Javascript code that creates the calendar visualization. We'll walk through each part.

var width = 700,
    height = 90,
    cellSize = 12;

// big integers
var formatStuff = d3.format(",");

/*
TEH COLORRRZZZZ
*/
var realBackgroundColor = "#272b30";
var tileBackgroundColor = realBackgroundColor;//"#3a3a3a";
var tileStrokeColor     = "#3a3a3a";
var monthStrokeColor    = "#4a4a4a";

var color = d3.scaleQuantize()
    .domain([0, 60])
    .range(["#4d2b4b","#5a3961","#684777","#77558f","#8463a5","#cc9189","#fba25c","#f78e43","#f47b2b","#f16913"]);
// purple orange

The canvas goes on the div tag with id calendar:

/*
Make the canvas
*/
var svg = d3.select("div#calendar")
  .selectAll("svg")
  .data(d3.range(2010, 2019).reverse())
  .enter().append("svg")
    .attr("width", width)
    .attr("height", height)
  .append("g")
    .attr("transform", "translate(" + ((width - cellSize * 53) / 2) + "," + (height - cellSize * 7 - 1) + ")");


/*
Write the years
*/
svg.append("text")
    .attr("transform", "translate(-6," + cellSize * 3.5 + ")rotate(-90)")
    .attr("font-family", "sans-serif")
    .attr("font-size", 10)
    .attr("fill", "#bbb")
    .attr("text-anchor", "middle")
    .text(function(d) { return d; });

The next two portions are the meat of the calendar visualization, drawing the tiles and outlines:

/*
Draw the tiles representing days of the year
(also draw tile outlines)
*/
var rect = svg.append("g")
    .attr("fill",   tileBackgroundColor)
    .attr("stroke", tileStrokeColor)
  .selectAll("rect")
  .data(function(d) { return d3.timeDays(new Date(d, 0, 1), new Date(d + 1, 0, 1)); })
  .enter().append("rect")
    .attr("width", cellSize)
    .attr("height", cellSize)
    .attr("x", function(d) { return d3.timeWeek.count(d3.timeYear(d), d) * cellSize; })
    .attr("y", function(d) { return d.getDay() * cellSize; })
    .datum(d3.timeFormat("%Y-%m-%d"));


/*
Draw outlines of groups representing months
*/
svg.append("g")
    .attr("fill", "none")
    .attr("stroke", monthStrokeColor)
  .selectAll("path")
  .data(function(d) { return d3.timeMonths(new Date(d, 0, 1), new Date(d + 1, 0, 1)); })
  .enter().append("path")
    .attr("d", pathMonth);

Now, the code that loads the data, filters it, performs any calculations, and draws colored rectangles on top of the baseline square grid:

/*
Load up the csv file
*/
d3.csv("page_edits.csv", function(error, csv) {
  if (error) throw error;

  /*
  This is where you decide what values to plot
  */
  var data = d3.nest()
        .key(function(d) { return d.timestamp ; })
        .rollup(function(d) { 
            return d[0].edits; 
        })
        .object(csv);

  rect.filter(function(d) { return d in data; })
        .attr("fill", function(d) { return color(data[d]); })
        .append("title")
        .text(function(d) { return d + ": " + formatStuff(data[d]); });
});

Finally, the most mysterious bit of magic in this code is the code that draws the squares around the months. This has to use the coordinates of the beginning and end of the months to draw a complicated square path.

It's magic, it works, we're happy.

function pathMonth(t0) {
  var t1 = new Date(t0.getFullYear(), t0.getMonth() + 1, 0),
      d0 = t0.getDay(), w0 = d3.timeWeek.count(d3.timeYear(t0), t0),
      d1 = t1.getDay(), w1 = d3.timeWeek.count(d3.timeYear(t1), t1);
  return "M" + (w0 + 1) * cellSize + "," + d0 * cellSize
      + "H" + w0 * cellSize + "V" + 7 * cellSize
      + "H" + w1 * cellSize + "V" + (d1 + 1) * cellSize
      + "H" + (w1 + 1) * cellSize + "V" + 0
      + "H" + (w0 + 1) * cellSize + "Z";
}

Final result

The finished product, visualizing edits to charlesreid1.com/wiki/ and commits to git.charlesreid1.com, can be seen at the following links:

Tags:    javascript    d3    computer science    python    colors   

Project Euler Problem 172

Posted in Mathematics

permalink

Table of Contents


Overview: Problem 172

How many 18-digit numbers \(n\) (without leading zeros) are there such that no digit occurs more than three times in \(n\)?

Link to Project Euler Problem 172

Background

Project Euler Problem 172 is your classic Project Euler problem: short, simple, and overwhelmingly complicated.

To nail this one, it's important to start simple - very simple. What I'll do is walk through the process of breaking this problem down to find and generalize the patterns needed to count permutations of digits.

First, in combinatorics problems it is important to think about what is changing, and how to count possible outcomes one piece at a time. Then the overall pieces can be combined to get the total count. In this case, we can think about a case for each digit: the case of 3 occurrences, the case of 2 occurrences, the case of 1 occurrence, and the case of 0 occurrences. Depending on the case, we limit our choices for later digits.

Let's start with a similar, but much simpler, problem: how do we construct a binary number with N digits and no more than m 0s and no more than m 1s?

In fact, let's make it even easier: how do we construct a 10 digit binary number with no more than 5 0's and no more than 5 1's?

The answer is, there is only ONE way to choose no more than 5 0's and no more than 5 1's to form a 10 digit number, and that's by having exactly 5 0's and 5 1's. Now that we know exactly how many of each digit we have, we can count the number of permutations of the number 0000011111 (the number of permutations).

Multiset Permutations

Note that multiset permutations are also discussed on the following wiki pages and blog posts:

If we are selecting from a group of \(N_1\) things of type A, \(N_2\) things of type B, and \(N_3\) things of type C to form a total of \(N\) things, this type of combinatorics problem is called a multiset permutation, and the total number of ways of arranging this set of 3 things is given by:

$$ \binom{N}{N_1, N_2, N_3} = \dfrac{N!}{N_1! N_2! N_3!} $$

In fact, this generalizes, for \(k\) classes of things we have a \(k\)-set permutation:

$$ \binom{N}{N_1, \dots, N_k} = \dfrac{N!}{N_1! \dots N_k!} $$

A Simple Problem (And Solution)

Back to the problem at hand: to count the number of ways of placing 5 0s and 5 1s to form a 10 digit number.

Once we place 5 digits into any of the 10 available slots, that fixes the locations of the remaining 5 digits. However, we still have to include two 5! values, to account for all possible duplicates if we exchanged all 5 of the 1s with one another, or all 5 of the 0s with one another. We use the expression:

$$ \binom{10}{5} = \dfrac{10!}{5! 5!} = 10 \times 9 \times 8 \times 7 \times 6 $$

A slightly More Complicated Problem

To solve a slightly more complicated problem: suppose we have to assemble a 10-digit binary number from no more than 6 0s and no more than 6 1s?

Now we have 3 possible cases of numbers of 0s:

4 0s: 0000111111 - and its permutations

5 0s: 0000011111 - and its permutations

6 0s: 0000001111 - and its permutations

For each of these cases, we can think of it as the "bucket" of 0s containing 4 0s (5 and 6 0s, respectively) and the "bucket" of 1s containing 6 1s (5 and 4 1s, respectively). We still have a number of permutations that we can form using this given number of 0s and 1s, given by a multiset permutation expression.

For each case, we have a multiset permutation expression that tells us how many permutations we can form from the given number of 0s and 1s:

$$ \binom{ N }{ N_0, N_1 } $$

So we have three possible outcomes, and the total number of arrangements is the sum of these three cases:

$$ N_{perms} = \binom{ 10 }{ 6, 4} + \binom{ 10 }{ 5, 5 } + \binom{ 10 }{ 6 , 4 } $$

Algorithm

We can generalize the process. Suppose we are forming a number of length N from a number of digits/classes \(k\) labeled from \(0 \dots k-1\), and each digit/class can only appear a maximum of \(m\) times.

The number of combinations that can be formed for a given \(N, k, m\) is given by the multiset permutation expression above. So the total number of permutations that can be formed is a sum of these multiset permutation expressions, over each possible combination of digits/classes into a number of length \(N\).

In computer science terms, we can think of this as a nested for loop or dynamic program; in mathematical terms, we can think of a sequence of summations whose limits depend on the variables in the other summations.

$$ \sum_{N_1} \sum_{N_2} \dots \sum_{N_k} \binom{N}{N_0, N_1, N_2, \dots, N_{k-1}} $$

where the limits of the summations are given by:

$$ N_1 = \min \left(N - (k-1) m, 0 \right) \dots m $$
$$ N_2 = \min \left( N - N_1 - (k-2) m, 0 \right) \dots m $$

etc...

$$ N_{k-1} = \min \left( N - N_1 - N_2 - \dots - N_{k-2}, 0 \right) \dots m $$

these all fix the number of zeros N_0:

$$ N_0 = N - N_1 - N_2 - N_3 - \dots - N_k $$

Notice that we ignore N_0 in the list of summations, because fixing the number of the first k-1 digits/classes (1s, 2s, 3s, ..., (k-1)s) will fix the number of 0s. Alternatively, we could count 0s and include a summation over \(N_0\), and eliminate the last summation over \(k-1\).

However, the multiset permutation expression includes ALL of the N's, from \(N_0\) to \(N_{k-1}\), since the choice of each variable leads to additional permutations.

Also note that any algorithm implementing this procedure can save time by checking if, for the preceding combinations of \(N\), we have already reached the maximum possible digits that can be selected. (Alternatively, we could write the upper limit of the summations as expressions depending on the prior values of \(N_i\), but we'll keep it simple.)

Ignoring Numbers Starting with Zero

We have one last hurdle remaining, and that is how to ignore numbers that start with 0.

If we think about the problem as selecting the number of times each digit is repeated, then assembling that selection into all possible permutations, fixing the first digit as 0 is equivalent to removing one from the total length of the number that must be assembled, and removing one from the possible 0s that will go in the final number. Thus, if we are assembling an N digit number from \(N_0\) 0s, \(N_1\) 1s, \(N_2\) 2s, \(N_3\) 3s, on up to \(N_9\) 9s, then the total number of permutations is given by:

$$ \binom{ N }{N_0, N_1, \dots, N_9} $$

If we fix the first digit as 0, the remaining number of permutations is given by:

$$ \binom{N-1}{ N_0-1, N_1, \dots, N_9 } $$

Therefore, the number of permutations, excluding those beginning with 0, is written:

$$ \binom{ N }{N_0, N_1, \dots, N_9} - \binom{N-1}{ N_0-1, N_1, \dots, N_9 } $$

Also, it is important to note that if N_0 = 0 to begin with, there are no possible ways of assembling numbers that begin with 0 because there are no 0s in the number, so the second term becomes 0:

$$ \binom{ N }{0, N_1, \dots, N_9} - 0 $$

Code

Test Cases

Test Case 1

Assemble two digits \(\{0,1\}\) into a 10-digit number, if each digit \(\{0,1\}\) can occur up to 5 times.

In this case, we know that 0 and 1 must occur exactly 5 times each. Now we are asking how we can assemble two sets of 5 things into 10 slots. This is a multiset permutation problem:

$$ \binom{10}{5,5} = \dfrac{10!}{5! \cdot 5!} = \dfrac{10 \cdot 9 \cdot 8 \cdot 7 \cdot 6}{5 \cdot 4 \cdot 3 \cdot 2 \cdot 1} = 252 $$

But wait! We also want to exclude numbers starting with 0, so we actually have:

$$ \binom{10}{5, 5} - \binom{9}{4, 5} = 126 $$

which is half of 252 - exactly what we would expect.

Test Case 2

Assemble three digits \(\{[0, 1, 2\}\) into a 6-digit number, if each digit \(\{0, 1, 2\}\) can occur up to 3 times. No number should start with 0.

In the prior case, we had one outcome of number of 0s and 1s, but in this case, we have a larger number of outcomes that we might see.

Evaluating the expressions for the limits of \(N_i\), we get:

$$ \sum_{N_0 = 0}^{3} \sum_{N_1 = \max(0, 3 - N_0) }^{3} \binom{6}{N_0, N_1, (N-N_0-N_1)} $$

where \(N_2 = N - N_0 - N_1\). Written out, this becomes the total number of possible 6-digit numbers,

$$ a = \binom{6}{0,3,3} + \binom{6}{1,2,3} + \binom{6}{1,3,2} + \binom{6}{2,1,3} + \binom{6}{2,2,2} + \\ \binom{6}{2,3,1} + \binom{6}{3,0,3} + \binom{6}{3,1,2} + \binom{6}{3,2,1} + \binom{6}{3,3,0} $$

minus the number of 6-digit numbers starting with 0:

$$ b = 0 + \binom{5}{0,2,3} + \binom{5}{0,3,2} + \binom{5}{1,1,3} + \binom{5}{1,2,2} + \\ \binom{5}{1,3,1} + \binom{5}{2,0,3} + \binom{5}{2,1,2} + \binom{5}{2,2,1} + \binom{5}{2,3,0} $$

Let \(a\) be the first expression and \(b\) be the second expression; then the total is:

In [40]: np.sum(a)
Out[40]: 510.0

In [41]: np.sum(b)
Out[41]: 170.0

In [42]: np.sum(a) - np.sum(b)
Out[42]: 340.0
$$ a - b = 340 $$

Recursion

The essence of this problem is a nested for loop - but because we have 9 digits to deal with, a 9-level nested for loop would be a big headache and would not generalize well.

Instead, we can write a recursive method that is called for each of the \(k\) (9) digits being selected to compose the final \(N\)- (18-) digit number.

The recursive method looks something like this:

global variable solution_count
global variable m
global variable N

def recursive_method( n_tuple, n) {
    if(n==9) {
        compute multiset permutation combinations
        increment global solutions total
        need N, N0, N1, N2, etc.
    } else {
        assemble choices for N_i
        for(choice in choices) {
            set N_i to choice
            call recursive_method()
            unset N_i
        }
    }
}

Pseudocode

Computing the number of possible integers n that meet the specified criteria thus boils down to a long sequence of nested summations (nested loops).

The problem is posed for \(N = 18, k = 10, m = 3\). For this case, the final expression for the total number of permutations is:

$$ \sum_{N_1} \sum_{N_2} \sum_{N_3} \sum_{N_4} \sum_{N_5} \sum_{N_6} \sum_{N_7} \sum_{N_8} \sum_{N_9} \binom{N}{N_0, N_1, N_2, \dots, N_9} - \binom{N-1}{N_0-1, N_1, N_2, \dots, N_9} $$

where the limits of summation are given by:

$$ N_1 = \max \left( N - (10-1) m, 0 \right) \dots m $$
$$ N_2 = \max \left( N - N_1 - (10-2) m, 0 \right) \dots m $$
$$ N_3 = \max \left( N - N_1 - N_2 - (10-3) m, 0 \right) \dots m $$
$$ N_4 = \max \left( N - N_1 - N_2 - N_3 - (10-4) m, 0 \right) \dots m $$

etc...

$$ N_9 = \max \left( N - N_1 - N_2 - \dots - N_7 - N_8, 0 \right) \dots m $$

and from these, \(N_0\) is determined by:

$$ N_0 = N - N_1 - N_2 - \dots - N_8 - N_9 $$

Python Code

Link to Problem 172 Python Code at git.charlesreid1.com

To implement the solution to Problem 172 in Python, we used recursion, as mentioned above. THe only tricky part of implementing this recursive method was the usual challenge with recursive methods: keeping track of the total number of solutions found via a global variable.

To do this in Python, we declare a variable outside the scope of a given function, and we use that variable as a global variable by declaring it with the global keyword.

import numpy as np

# Real problem:
k = 10
m = 3
N = 18


solution_count = 0
factorials = {}

Now we have a main() driver method to call the recursive method:

def main():
    global solution_count
    n_tuple = [None,]*k
    recursive_method(n_tuple,1)
    print("Total number of permutations:")
    print("%d"%(solution_count))

We have the recursive backtracking method that constructs all combinations of \(k\) digits into \(N\)-digit numbers:

def recursive_method( n_tuple, ni ):
    """
    Use recursive backtracking to form all possible 
    combinations of k digits into N-digit numbers 
    such that the number of digits is m or less.

    (n_tuple is actually a list.)

    ni = current class step 1..(k-1)
    n_tuple = list of number of digits for each class 0 through k
    """
    global solution_count, k, m, N
    if(ni==k):

        # N_1 through N_(k-1) have been set,
        # now it is time to set N_0:
        # N_0 = N - N_1 - N_2 - N_3 - .. - N_{k-1}
        sum_N = np.sum([n_tuple[j] for j in range(1,k)])
        n_tuple[0] = max(0, N-sum_N)

        # Compute multiset permutation
        solution_count += multiset(N,n_tuple) - multiset_0(N,n_tuple)

        return

    else:

        # Problem: we are not stopping 
        # when the sum of digits chosen
        # is greater than N

        # Assemble the minimum and maximum limits for N_i:
        # (Everything up to ni-1 should be defined, no TypeErrors due to None)
        sum_N = np.sum([n_tuple[j] for j in range(1,ni)])
        ktm = (k - ni)*m
        expr = N - sum_N - ktm
        minn = int(max( 0, expr ))

        # Note: previously this was just maxx=m.
        # This required a check around each call to
        # recursive_method to see if the sum of n_tuple
        # was already maxed out. Now we just do it here.
        maxx = min(m, N-sum_N)

        for N_i in range(minn,maxx+1):

                # Set
                n_tuple[ni] = N_i

                # Explore
                recursive_method(n_tuple, ni+1)

                # Unset
                n_tuple[ni] = None

        return

We have a multiset() method that evaluates the multiset permutation count formula:

$$ \binom{N}{N_1, \dots, N_k} = \dfrac{N!}{N_1! \dots N_k!} $$
def multiset(N, n_tuple):
    """
    Number of multiset permutations
    """
    r = factorial(N)/(np.product([factorial(j) for j in n_tuple]))
    return r


def multiset_0(N, n_tuple):
    """
    Number of multiset permutations that start with 0
    """
    if(n_tuple[0]>0):
        r = factorial(N-1)/(np.product([factorial(j-1) if(i==0) else factorial(j) for i,j in enumerate(n_tuple)]))
        return r
    else:
        return 0

And finally, we have a factorial() method:

def factorial(n):
    """
    Factorial utility
    """
    if(n<0):
        raise Exception("Error: negative factorials not possible")
    if(n==1 or n==0):
        return 1
    else:
        return n*factorial(n-1)

At the bottom of the file, we ensure that the driver is run when the funtion is run directly through Python:

if __name__=="__main__":
    main()

Final Answer

Setting the correct parameters should result in the following result:

$$ P = 227,485,267,000,992,000 $$
Tags:    computer science    mathematics    factors    sequences    euler    project euler   

March 2022

How to Read Ulysses

July 2020

Applied Gitflow

September 2019

Mocking AWS in Unit Tests

May 2018

Current Projects