charlesreid1.com blog

Undergraduate Research Project: Wireless Sensor Networks for Internet of Things Applications (Part 1: The Project)

Posted in Wireless

permalink

Table of Contents:

Overview of the Undergraduate Research (UGR) Project

South Seattle UGR Project

For the past year, in addition to my duties as a computer science and math instructor at South Seattle College, I have served as a research mentor for an NSF-funded undergraduate research project involving (off-and-on) five different South Seattle students - all of whom have expressed interest in transferring to the University of Washington's computer science program after they finish at South Seattle College.

The students have various levels of preparation - some have taken calculus and finished programming, while others are just starting out and have no programming experience outside of "programming lite" languages like HTML and CSS.

But it's also been an extremely rewarding opportunity. I have gotten the chance to kindle students' interests in the vast world of wireless security, introduced them to essential technologies like Linux, helped them get hands-on experience with NoSQL databases, and guided them through the process of analyzing a large data set to extract meaningful information - baby data scientists taking their first steps.

These are all skills that will help equip students who are bound for university-level computer science programs, giving them both basic research skills (knowing the process to get started answering difficult, complex questions) and essential tools in their toolbelt.

Two students who I mentored as part of a prior UGR project last year (also focused on wireless networks and the use of Raspberry Pi microcomputers) both successfully transferred to the University of Washington's computer science program (one in the spring quarter of 2016, the other in the fall of 2016). Both students told me that one of the first courses they took at the University of Washington was a 2-credit Linux laboratory class, where they learned the basics of Linux. Having already installed Linux virtual machines onto their personal computers, and having used technologies like SSH to remotely connect to other Linux machines, they both happily reported that it was smooth sailing in the course, and it was one less thing to worry about in the process of transferring and adjusting to the much faster pace of university courses.

Engineering Design Project

The project was entitled "Wireless Sensor Networks for Internet of Things Applications," and was intended to get students introduced to the basic workflow of any internet of things system: a sensor to collect data, a wireless network to connect sensors together, a warehouse to store data collected from sensors, and a workflow for analyzing the data to extract meaningful information.

The focus was to implement a general workflow using tools that could extend to many internet of things applications, be they commercial, residential, or industrial.

However, the NSF grant provided only a modest amount of funding, intended to go toward stipends to pay students and mentors a modest amount during the quarter, with only modest amounts of money for basic equipment. (We were basically running a research project on a $100 budget.)

That meant the project had to be flexible, scrappy, and run on a shoestring budget. This meant we were limited to cheap, off-the-shelf technologies for the sensors, the sensor platform, and the back-end infrastructure. Two technologies in particular lent themselves nicely to these constraints:

  • Wireless USB antennas - USB wifi dongles are cheap ($10), and the ubiquity of wireless networks and wifi signals meant this would provide us with a rich data set on the cheap.

  • Raspberry Pi - the Raspberry Pi is a credit-card sized microcomputer that runs a full stack Linux operating system. With the low price point ($30) and the many free and open-source tools available for Linux, this was a natural choice for the sensor platform.

The result was a set of wireless sensors - Raspberry Pis with two wireless antennas - one antenna for listening to and collect wireless signal data in monitor mode, and one antenna to connect to nearby wireless networks to establish a connection to a centralized data warehouse server.

Project Components: Extract, Store, and Analyze

The wireless sensor network project had three major components:

  • Extract - using a wireless USB antenna, the Raspberry Pi would listen to wireless signals in the area, creating a profile of local network names, MAC addresses, signal strengths, encryption types, and a list of both clients and routers. Students used the aircrack-ng suite to extract wireless signal information.

  • IMPORTANT SIDE NOTE - students also learned about wiretapping laws and various legal aspects of wireless networks - the difference between monitoring ("sniffing") wireless traffic versus simply building a profile of wireless traffic.

  • Store - students learned about NoSQL databases (we used MongoDB) and set up a NoSQL database to store information about wireless signals. This also required some basic Python programming, as the wireless signal information was exported to a large number of CSV files and had to be programmatically collated and extracted.

  • Analyze - the pinnacle of the project was in the analysis of the wireless signal data that was captured. Students ran several "experiments," collecting wireless signals for 2 hours using a portable battery and a Raspberry Pi with wifi dongles. By running experiments under different conditions (at the college library, at a coffee shop, on a bus), a diverse set of data was gathered, allowing students to extract meaningful information about each experiment from each data set.

The Internet of Things: Not Just a Buzzword

One of the biggest challenges starting out was in getting the students into the right "mindset" about the Internet of Things. This was a challenge that I did not forsee when I came up with the project title. As a chemical engineer working on natural gas processing at a startup company, I knew the value of creating wireless infrastructure to extract data from sensors, throw it into a giant bucket, and utilize computational tools to analyze the data and extract information from it.

But the students involved in the project had no exposure to this kind of workflow. To them, the Internet of Things meant toasters and TVs that were connected to the internet, so they were expecting a design project in which we would make a prototype consumer device intended to connect to the internet.

Further complicating things was the fact that we were focusing on building a data acquisition system - a data analysis pipeline - a workflow for extracting, storing, and analyzing sensor data. We were not focused on the specific types of questions that our specific type of data could answer. This was a bit puzzling for the students (who could not see the intrinsic value of building a data analysis pipeline). Much of their time was spent struggling with what, exactly, we were supposed to be doing with the data, and getting past a contaminated, consumer-centric view of the term "Internet of Things."

It was, therefore, a major breakthrough when one of the students, as we were diving deeper into the data analysis portion, utilizing Python to plot the data, quantitatively analyze it, and better understand it, told me, "Looking back, I realize that I was thinking really narrowly about the whole project. I thought we were going to build a 'smart' device, like a business project. But now I realize our project has a bigger scope, because of the analysis part."

That, in a nutshell, was precisely the intention of the project.

University of Washington Undergraduate Research Symposium

Next week the students present the culmination of their research project at the University of Washington's Undergraduate Research Symposium, where they will have a poster that summarizes their research effort, the results, and the tools that were used.

It is clear to anyone attending the Undergrad Research Symposium that community college students are among the minority of students who are involved in, and benefiting from, research projects. The intention of most of the projects showcased at the symposium is to launch undergraduate students into a graduate level research career and prepare them to hit the ground running, and have a stronger resume and application, when they have finished their undergraduate education and are applying to graduate schools. Many of the research posters at the symposium showcase research using expensive equipment, specialized materials and methods, and complex mathematical methods. Many of the students are mentored by world-class research professors with deep expertise and small armies of graduate and postgraduate researchers.

Despite our research efforts being completely outmatched by many of the undergraduate researchers from the University of Washington (out-funded, out-manned, and out-gunned), our group managed to pull together a very interesting and very ambitious design project that collected a very rich data set. The students were introduced to some useful tools and fields of computer science (wireless networks, privacy and security, embedded devices, databases, Linux), and exposed students to a totally new way of thinking about the "internet of things" that allows them to move beyond the shallow hype of internet-connected toothbrushes. The students have developed the ability to build a data pipeline that could be used by a company to address real, significant problems and needs around data.

All in all, this was an extremely worthwhile, high-impact project that's equipping the next generation of computer scientists with the cognitive tools to anticipate and solve data problems, which (as hardware becomes cheaper and embedded devices become more ubiquitous) are problems that will only become more common in more industries.

The Poster

Here's a rough draft of the poster we will be showing at the UGR symposium:
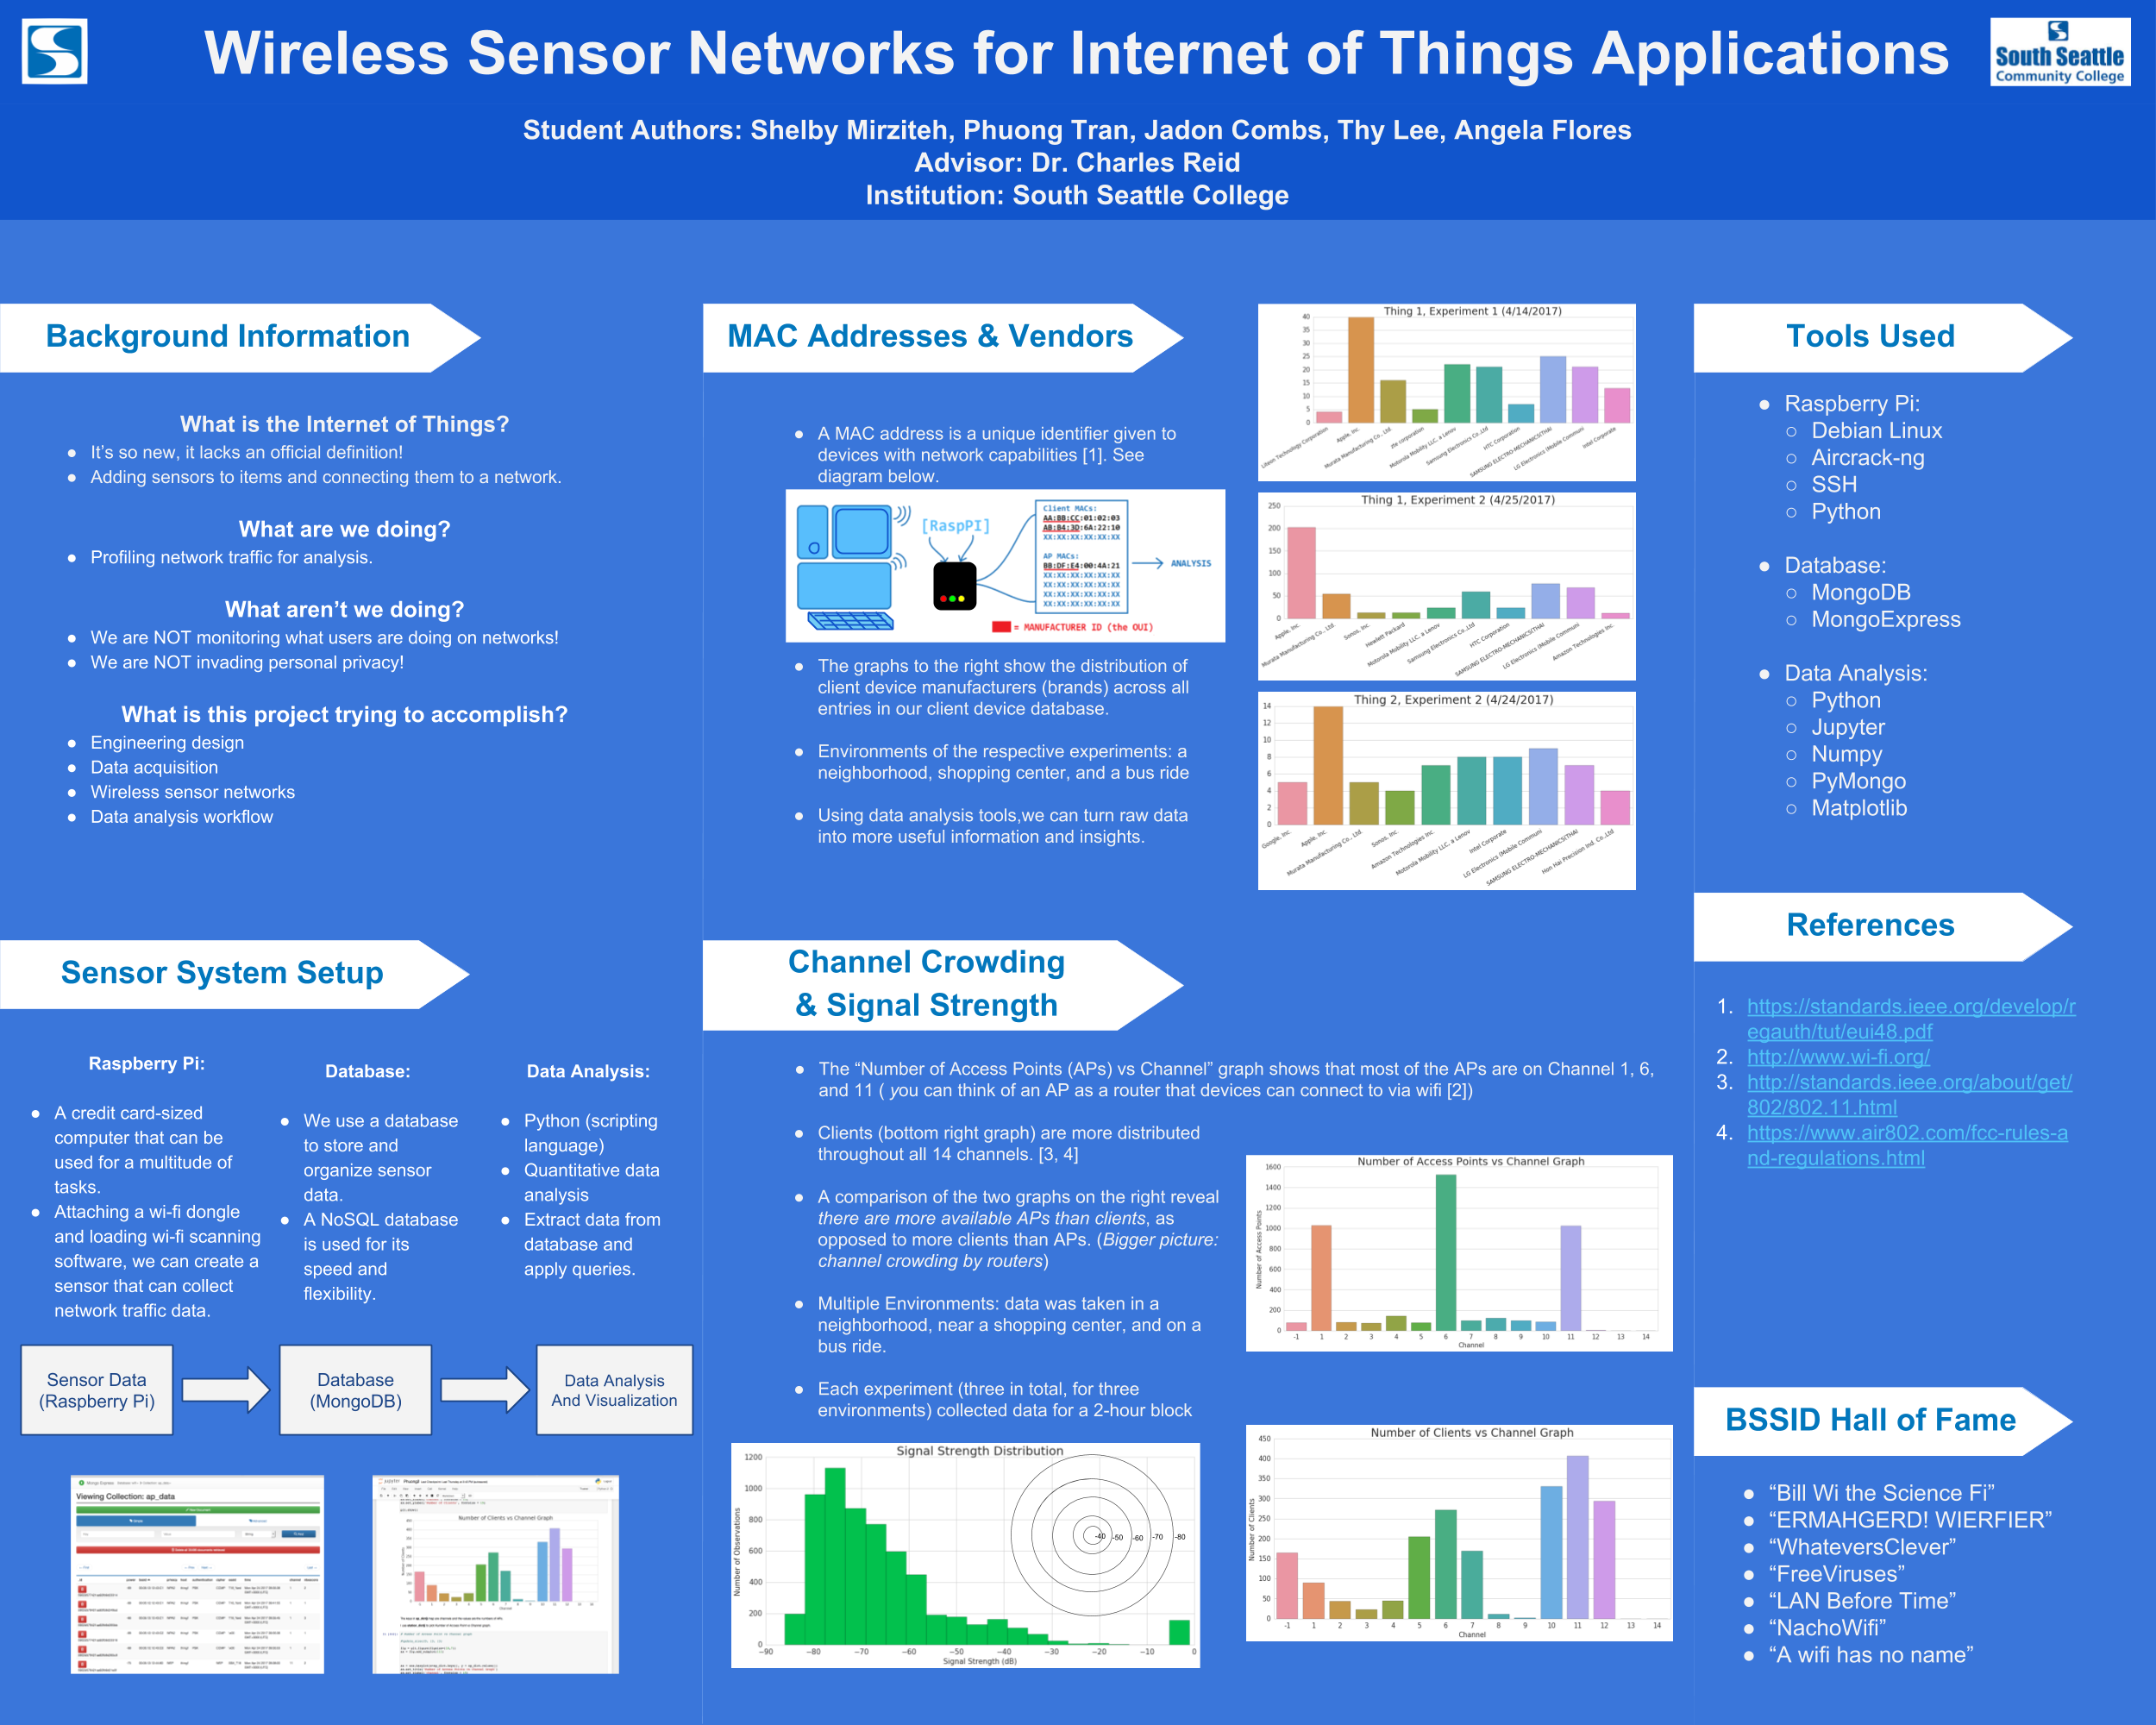
UGR Poster

Tags:    wireless    security    undergraduate research project    stunnel    SSH    aircrack    mongodb    python    jupyter    linux    raspberry pi   

Stunnel

Posted in Security

permalink

Introduction

What Does Stunnel Do?

Stunnel is a tool for creating SSL tunnels between a client and a server.

Creating SSL connections is a general task that is very useful. In particular, any packet of any protocol can always be wrapped in an additional SSL layer, with packets embedded within packets, so this means you can wrap arbitrary traffic protocols in SSL using Stunnel.

Stunnel requires a client and a server on either end of the tunnel.

This writeup assumes access to both the server and the client. If you don't have access to the client, the server certificate needs to be signed by a certificate authority that the client trusts. You can either:

  • Shell out big bucks for a certificate signed by a certificate authority company, thereby contributing to the ongoing racketeering of said companies;

  • Use a LetsEncrypt certificate, signed by a certificate authority for free; or

  • Use a self-signed certificate and install the certificate authority onto the client computer.

(These are all difficult and confusing processes, compounded by OpenSSL's lack of documentation and a proliferation of incorrect terminology. Good luck.)

How Does Stunnel Work?

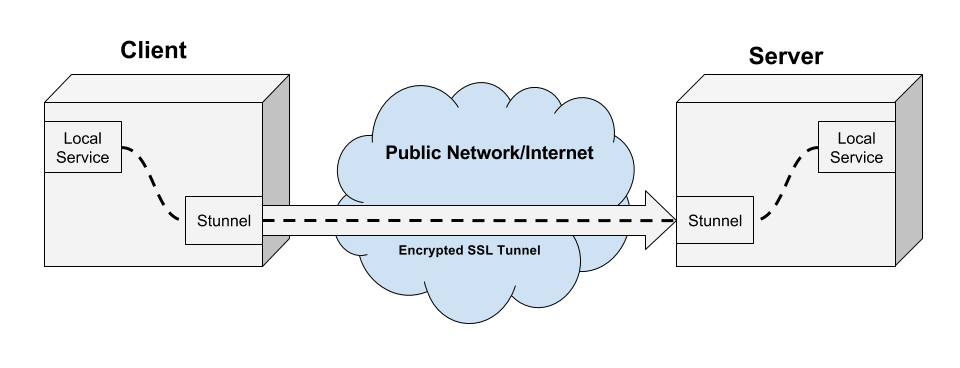
The client stunnel instance will encrypt traffic, and the server stunnel instance will decrypt traffic.

When encrypting traffic, stunnel accepts incoming traffic by listening on a port (almost always a local port). It will wrap the traffic in an encrypted SSL layer (TCP wrapping) using the SSL certificate/key that is shared between the client and the server. The client then sends out the encrypted traffic over an external connection, and on to the stunnel server.

When decrypting traffic, stunnel will listen on an external connection for incoming, encrypted SSL traffic. It will use its SSL certificate/key to decrypt the traffic and unwrap the SSL layer. It will then forward this traffic on to another (usually local) port.

Stunnel flowchart schematic

Setting Up an Stunnel Server

Stunnel servers can listen on any port, and the port you choose depends on the application. The configuration we're showing here is intended to bypass a network that is tightly controlled and locked down except for HTTP and HTTPS traffic (ports 80 and 443).

Consider an example of connecting a local service on local port 8443 (not open to the outside world) to an stunnel server listening on port 443 (open to the outside world).

stunnel will listen on port 443, open to external traffic, for SSL-encrypted stunnel traffic. This means that only stunnel can listen on 443 (so this cannot be a server for an HTTPS web site - if a user points their browser to https://yourstunnelserver.com stunnel will not understand the HTTPS request and will discard it). We can use stunnel on any port that we want, but communicating between stunnel clients and servers on port 443 allows us to disguise arbitrary traffic (HTTP, HTTPS, SSH, database, etc.) as legitimate HTTPS.

This is very useful if we have a firewall that is actively inspecting the type of traffic inside of packets, and dropping packets with particular protocols like SSH or OpenVPN. By wrapping that traffic in an SSL layer, there is no way for the firewall to inspect the contents of the packet, so it just looks like ordinary HTTPS traffic. The firewall can't decrypt the packet contents, so it doesn't know if you are visiting your bank, checking your email, or sneaking SSH/OpenVPN traffic through the firewall.

(Note that other services like Iodine allow you to do similar things with other protocols, like disguising network connections using encrypted DNS on port 53.)

Typically, stunnel is forwarding that traffic on to a local port, something like 8443. (The common scenario is if you have a service only exposed to LOCAL traffic from localhost or 127.0.0.1 and not bound to an EXTERNAL ip address like 0.0.0.0).

Charlesreid1.com Resources for Stunnel Servers

The charlesreid1.com wiki has an extensive guide to setting up an Stunnel server:

The charlesreid1.com git server has several repositories with configuration files for setting up an stunnel server:

  • d-stunnel repository - repo containing Docker configuration files, for creating a Docker container that runs an stunnel server. This repository contains example stunnel configuration files for running a number of different protocols over stunnel (ssh, http, and rsync).

Setting Up an Stunnel Client

Running an stunnel client requires installing stunnel and setting up a configuration file just like if you were setting up an Stunnel/Server, except swapping the accept and connect ports, since we want the client to accept local traffic (e.g., on port 8443) and send it on to the server that it connects to with SSL (e.g., on port 443).

Charlesreid1.com Resources for Stunnel Clients

The charlesreid1.com wiki has an extensive guide to setting up an Stunnel client:

The charlesreid1.com git server has several repositories with configuration files for setting up an stunnel client:

Example Protocols

One of the most beautiful aspects of networking is that packets can be wrapped within other packets - so theoretically it can be packets all the way down. This allows us to use stunnel's SSL TCP wrappers to wrap just about any traffic we want. This means we can run various services (encrypted or not) through stunnel, including but not limited to:

  • SSH (secure shell)

  • SCP (secure copy)

  • OpenVPN (virtual network)

  • Rsync (file transfer)

  • MongoDB (NoSQL database)

  • Redis (local-only NoSQL database)

While stunnel has a few pre-configured services that it can deal with, users can also define their own custom protocols, over whatever port they please.

The charlesreid1.com wiki details stunnel configuration for all of the above protocols, excepting MongoDB and redis. Here are links to pages specifying how to configure stunnel for each protocol:

The Rsync over stunnel page, in particular, details the steps needed to define your own custom protocol and have stunnel wrap it in an SSL layer correctly.

Stunnel with Docker

Docker is a useful way of managing services in a self-contained and reproducible manner. Running stunnel through a Docker container is surprisingly easy: once you've installed stunnel into the docker container, you just need to map the incoming port (containing incoming encrypted traffic from the client, linked to the external network interface) to the outgoing port (containing decrypted traffic from stunnel, linked to a local-only service on a closed port).

The charlesreid1.com wiki details how to create set up SSH over stunnel at the following page: * charlesreid1.com/wiki/Stunnel/Docker

The charlesreid1.com git server has an stunnel docker repository with configuration files for running a Docker stunnel server, along with several example stunnel server configuration files for handling protocols like rsync, ssh, and http: * d-stunnel repository

Troubleshooting Stunnel Connections

In the d-stunnel repository is a document called DEBUGGING.md that contains a number of techniques for debugging an stunnel connection.

Here is the direct link to DEBUGGING.md.

The techniques covered include:

  • Configuring stunnel to run in the foreground (print log messages to console instead of to log file)

  • Configuring stunnel to output debugging information

  • Poking the stunnel server with telnet

  • Inspecting open ports with nmap

  • Watching /var/log/syslog for activity

See DEBUGGING.md for details.

References

  1. "Stunnel". Charlesreid1.com wiki. 30 April 2017. <https://charlesreid1.com/wiki/Stunnel>

  2. "Category: Stunnel". Charlesreid1.com wiki. 30 April 2017. <https://charlesreid1.com/wiki/Category:Stunnel>

  3. "Stunnel/Server". Charlesreid1.com wiki. 30 April 2017. <https://charlesreid1.com/wiki/Stunnel/Server>

  4. "Stunnel/Client". Charlesreid1.com wiki. 30 April 2017. <https://charlesreid1.com/wiki/Stunnel/Client>

  5. "Stunnel/Docker". Charlesreid1.com wiki. 30 April 2017. <https://charlesreid1.com/wiki/Stunnel/Docker>

  6. "Stunnel/Certificates". Charlesreid1.com wiki. 30 April 2017. <https://charlesreid1.com/wiki/Stunnel/Certificates>

  7. "Stunnel/Rsync". Charlesreid1.com wiki. 30 April 2017. <https://charlesreid1.com/wiki/Stunnel/Rsync>

  8. "Stunnel/SSH". Charlesreid1.com wiki. 30 April 2017. <https://charlesreid1.com/wiki/Stunnel/SSH>

  9. "Stunnel/Scp". Charlesreid1.com wiki. 30 April 2017. <https://charlesreid1.com/wiki/Stunnel/Scp>

  10. "Stunnel/OpenVPN". Charlesreid1.com wiki. 30 April 2017. <https://charlesreid1.com/wiki/Stunnel/OpenVPN>

Tags:    stunnel    SSL    encryption    SSH    networking    OpenVPN   

Traveling Schoolteacher Problem

Posted in Java

permalink

The Traveling Schoolteacher Problem

The Traveling Schoolteacher Problem (TSTP) is a variation on the Traveling Salesperson Problem (TSP).

The Traveling Schoolteacher Problem supposes a schoolteacher that is traveling from school to school in order to give lessons at different schools. Being a poor schoolteacher, they are only able to afford an older car that gets bad mileage and has a small gas tank.

After visiting each school, the schoolteacher receives payment from the school, in the currency of \(P\) gallons of gasoline. Different schools pay the teacher different amounts of gasoline, further complicating matters. The schoolteacher's car has a small gas tank that can only hold a maximum of \(M\) gallons of gas, and the schoolteacher cannot travel with cans of gasoline. Any gasoline the schoolteacher receives above \(M\) gallons of gas must be left behind.

Traveling from a source node to a target node incurs a cost of \(C\) gallons of gas, deducted from the gas tank's total at the source node.

In an attempt to minimize losses and avoid running out of gas, the traveling schoolteacher must plan out a route that both avoids running out of gas and minimizes the total distance traveled.

The Mathematical Model

To represent this problem in the computer, we can use a graph - just like the Traveling Salesperson Problem solution - but modified a bit. Like the TSP, we can also solve the Traveling Schoolteacher Problem with recursive backtracking.

Each edge will represent a cost in gas, and each school arrived at will result in a payment in gas. Thus, the "real cost" of an edge will change depending on the state of the gas tank and the path taken to arrive there.

We can add a number to each node to represent the amount of gas that that school pays the schoolteacher. We can use a number in each edge to represent the amount of gas that it costs to travel from one school to another. The backtracking solution will explore various paths through teh graph, keeping track of the gas tank's running total and rejecting any paths that lead to an empty gas tank.

The Pseudocode

Revisiting the original Traveling Salesperson Problem, the recursive backtracking method we implemented was described with the following pseudocode:

explore(neighbors):

    if(no more unvisited neighbors):
        # This is the base case.
        if total distance is less than current minimum:
            save path and new minimum

    else:
        # This is the recursive case.
        if current distance is greater than current minimum:
            skip
        else:
            for neighbor in unvisited neighbors:
                visit neighbor
                explore(new_neighbors)
                unvisit neighbor

To modify this to solve the Traveling Schoolteacher Problem, we want to make a few additions:

  • Check if the gas tank is empty, and if so, don't explore this path
  • Check if the current distance is greater than our current minimum-distance path through the graph
  • Add gas from each school to the gas tank (up to the tank's maximum), subtract gas from each path from the gas tank

This results in the following pseudocode:

explore(neighbors):

    if(no more unvisited neighbors):
        # This is the base case.
        if total distance is less than current minimum:
            save path and new minimum

    else:
        # This is the recursive case.
        if gas tank is below empty:
            skip
        if current distance is greater than current minimum:
            skip
        else:
            add gas from this school to gas tank
            for neighbor in unvisited neighbors:
                visit neighbor
                deduct gas to get to neighbor from gas tank

                explore(new_neighbors)

                unvisit neighbor
                add gas back into gas tank

Once you have a backtracking algorithm for the original Traveling Salesperson Problem TSP, it's quite easy to make the few modifications required to solve the Traveling Schoolteacher Problem TSTP.

The Java Code

The Java code to solve the TSTP is organized into several classes:

  • TSTP class - implements the recursive backtracking solution method, and owns temporary variables used by backtracking.
  • Node class - the Node is a lightweight class that stores an integer, representing the amount of gas this school pays the teacher. (Note, Node stores no links. Graph links handled by Guava.)
  • Edge class - the Edge class is a lightweight class that stores an integer for each edge, representing the amount of gas this path costs to travel.
  • RandomNodeGraph - a static class that builds random graphs with nodes and edges pre-populated with values. Parameters like connectivity and maximum gas tank capacity can be passed to introduce variation and ensure the graph is solvable (or not).

TSTP Class Fields and Methods

The TSTP class implements several fields to store the graph, and to store temporary information about the current solution during recursive backtracking (such that it is accessible by each instance of the recursive method).

The class stores the current route in an integer array, along with the current path distance, the current minimum distance, and the current state of the gas tank.

The TSTP class has a public solve() method, which calls a private recursive backtracking explore() method to solve the problem.

The recursive method will have a base case and a recursive case.

  • The base case is that we have visited all cities on the graph. Check if this is a new solution, and if so, save it.

  • In the recursive case, we explore all solutions possible starting at the current node (passed in as a parameter), having already made N choices (passed in as a parameter). We do this by making a choice (and marking the node as visited), then exploring the consequences (through a recursive call), then unmaking the choice (rmarking the node as unvisited).

Here is the explore method header:

    /** Recursive backtracking method: 
        explore possible solutions starting 
        at this node, having made nchoices */
    public void explore(Node node, int nchoices) {

Explore: Base Case

The base case begins by checking if the minimum distance has been set, and if so, whether the current distance is larger than the minimum distance. If so, this route is abandoned; otherwise, we have a new solution.

        if(nchoices == graphSize) {
            // 
            // BASE CASE
            //
            if(this.this_distance < this.min_distance || this.min_distance < 0) {
                this.min_distance = this.this_distance;
                printSolution();
            } else {
                printFailure();
            }

        } else {

Explore: Recursive Case

Next, the recursive case will explore each of the possible choices open to it by iterating over each choice available at a node, and for each node, choosing it, exploring the results, and unchoosing it.

        } else {
            //
            // RECURSIVE CASE
            //  
            if(this.gas_tank <= 0) {
                // Bummer, man.
                return;
            }
            if(this.min_distance > 0 && this.this_distance > this.min_distance) {
                // Give up, there's no hope.
                return;
            }

            // Now the teacher teaches,
            // Now the teacher gets some gas. 
            // If the tank is full...  bummer, man.
            this.gas_tank += Math.min(this.tankSize, this.gas_tank + node.pay);

            // For each neighbor:
            Set<Node> neighbors = graph.adjacentNodes(node);
            for(Node neighbor : neighbors) {
                if(neighbor.visited == false) {

                    int distance_btwn = -10000;

                    // Using a for loop, 
                    // but there should only be one edge.
                    for( Edge edge : graph.edgesConnecting(node, neighbor) ) {
                        distance_btwn = edge.cost;
                    }

                    // Make a choice
                    this.route[nchoices] = neighbor.id;
                    neighbor.visit();
                    this.this_distance += distance_btwn;

                    // Explore the consequences
                    explore(neighbor,nchoices+1);

                    // Unmake the choice
                    this.route[nchoices] = -1;
                    neighbor.unvisit();
                    this.this_distance -= distance_btwn;
                }
                // Move on to the next choice (continue loop)
            }               
        } // End base/recursive case
    }

Example Graphs

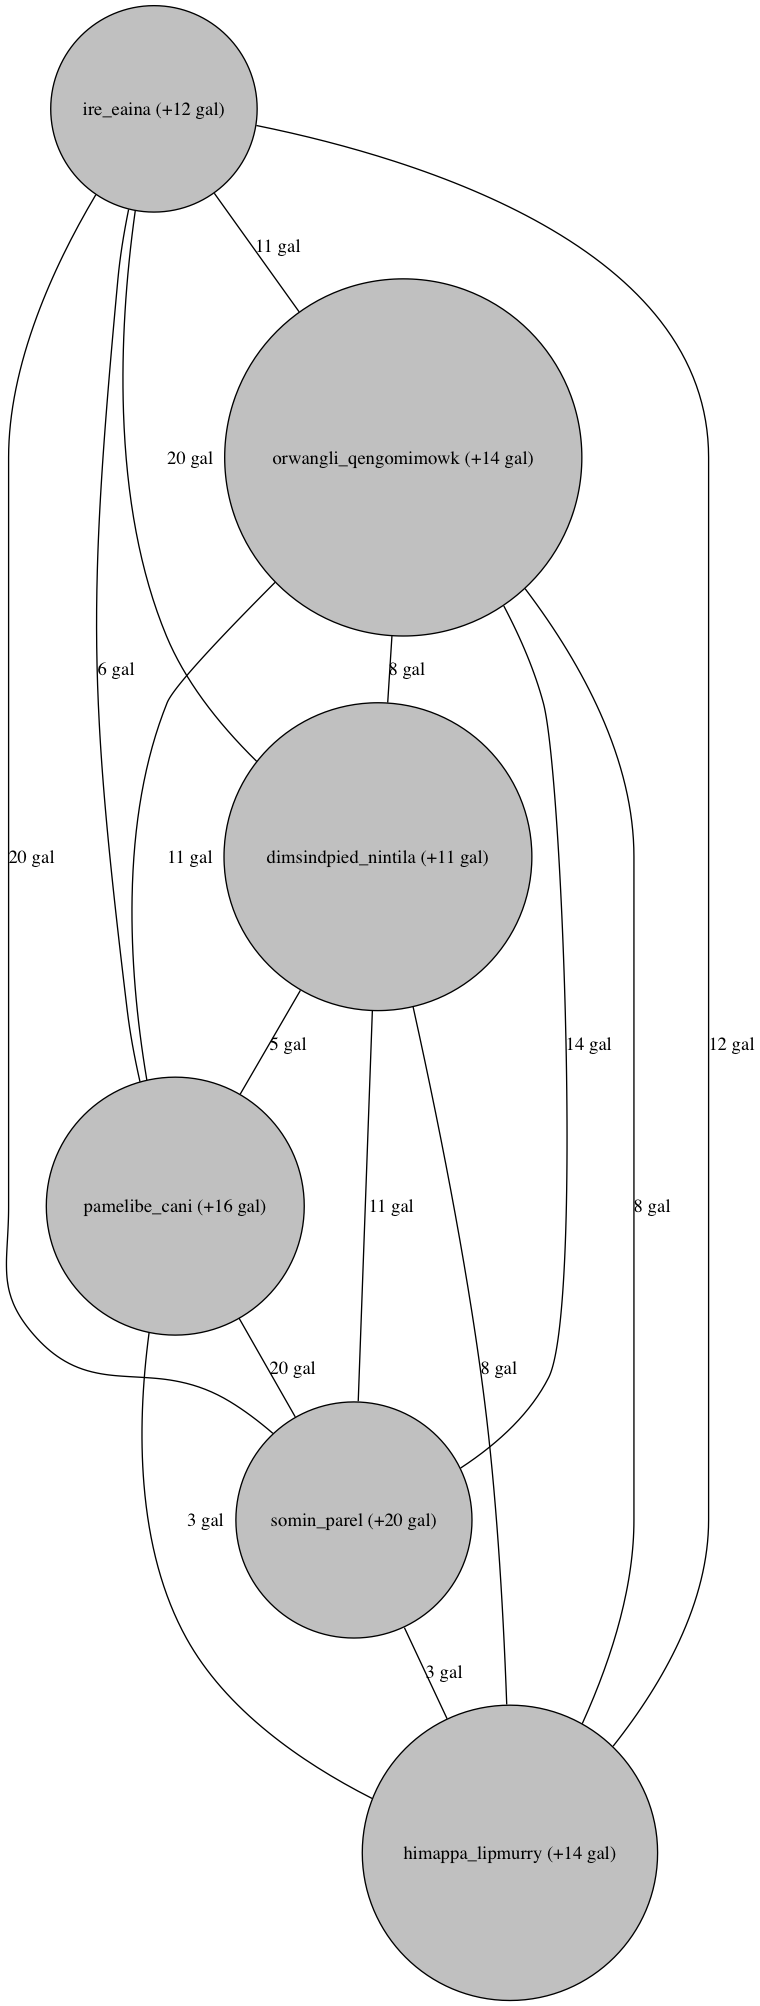
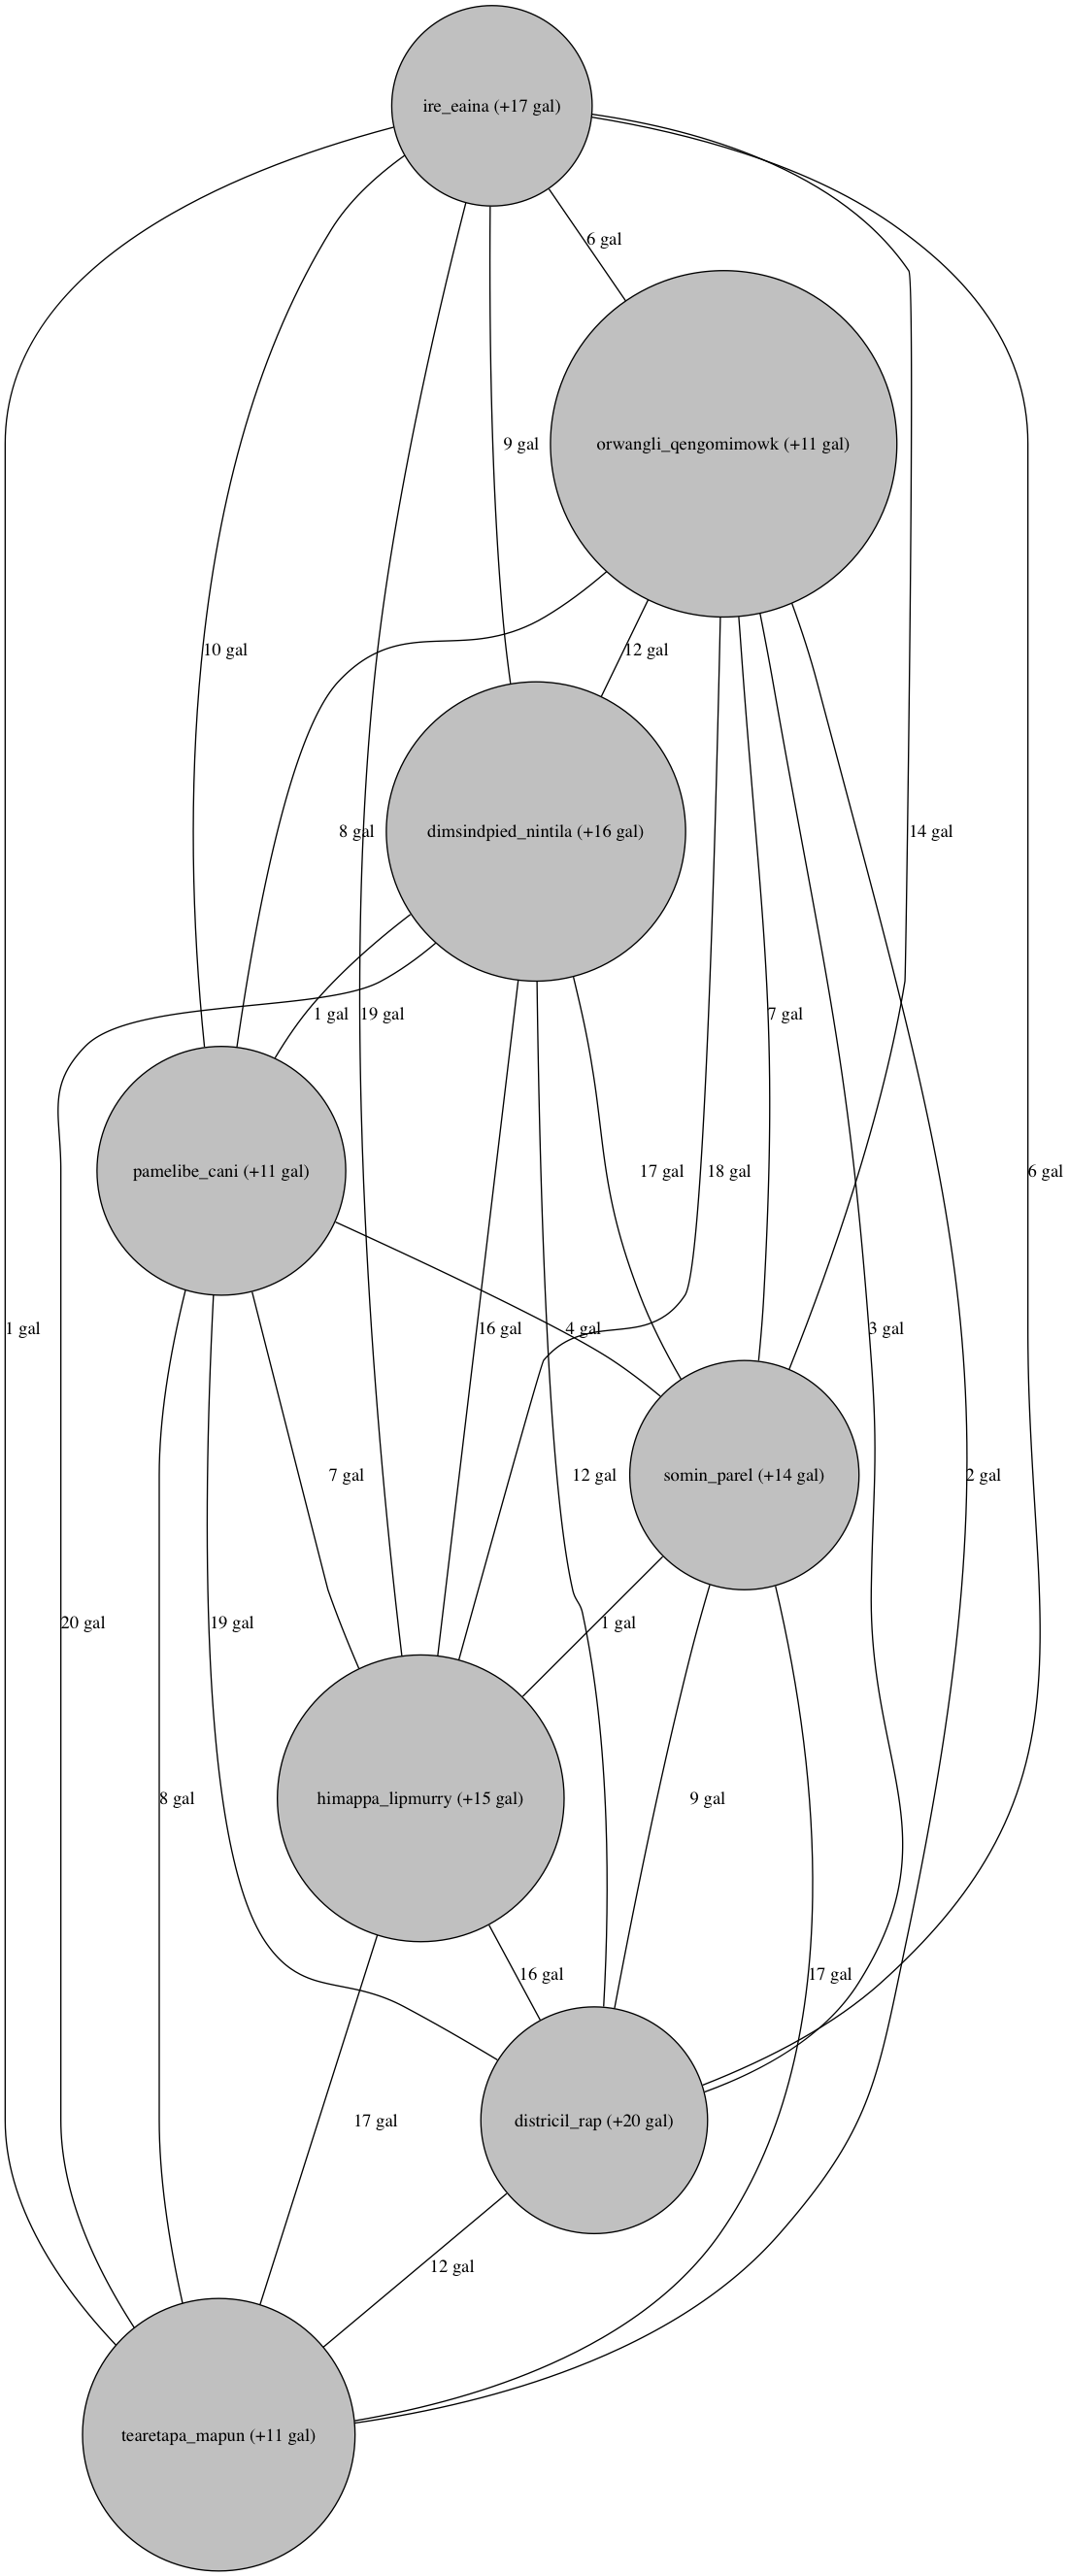
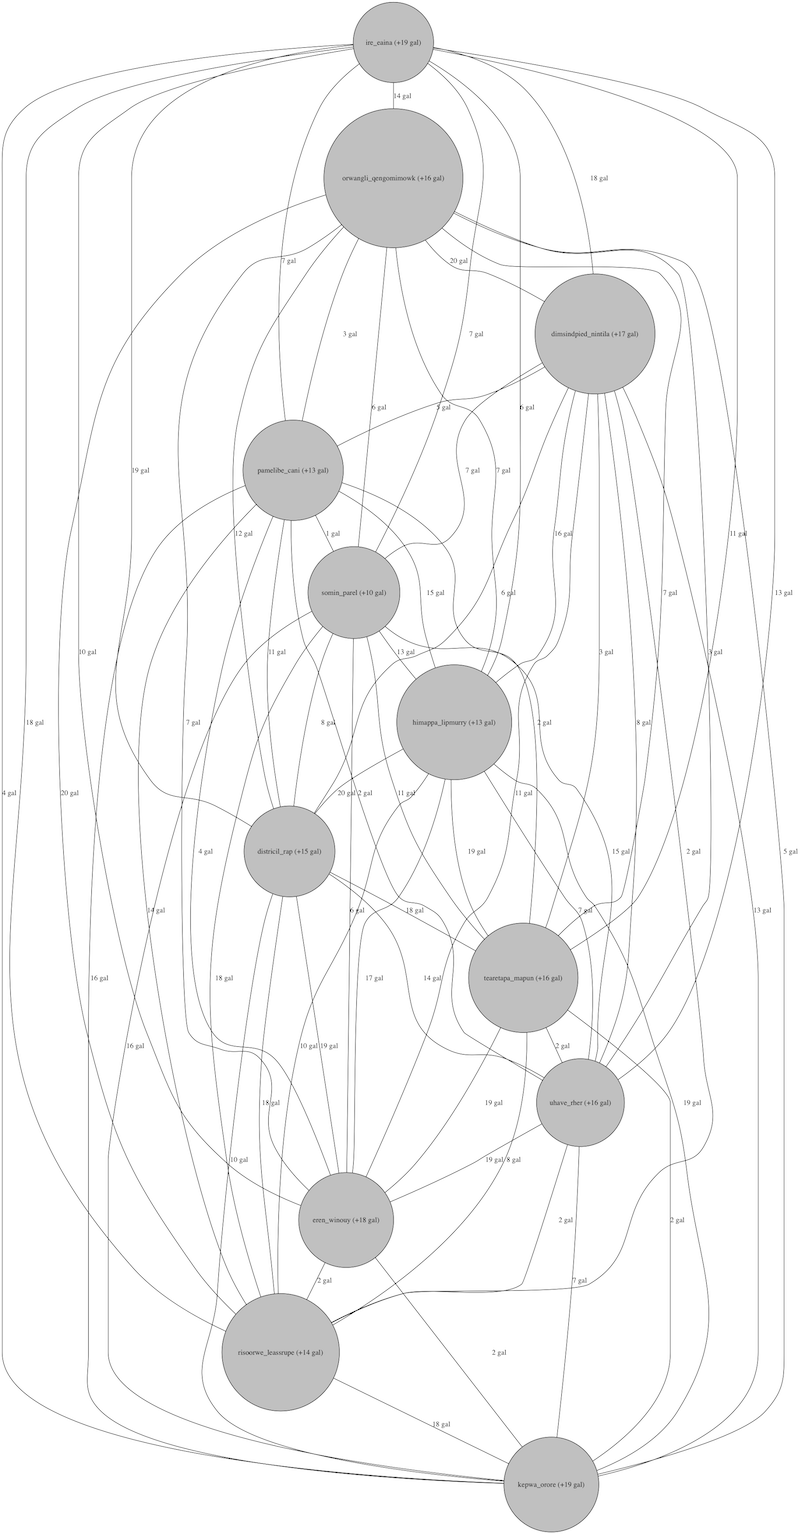
Just so you can see what they look like, here are a couple of graphs generated for the traveling schoolteacher problem:

Results

Walltime vs. Number of Nodes

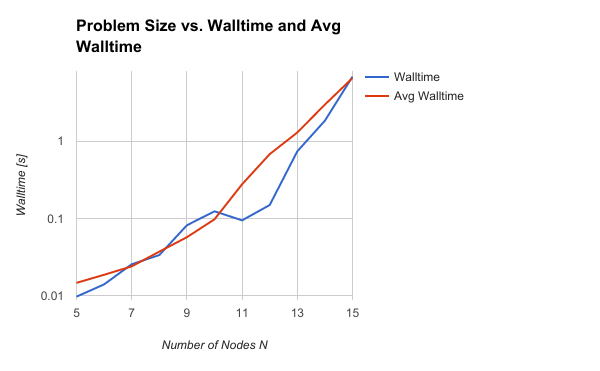
The following is a plot of walltime versus number of nodes:

This plot shows that the traveling schoolteacher problem is solved faster than the traveling salesperson problem. This makes sense - for a given city, many of the possible routes can be eliminated from the list of routes to explore, due to the additional constraint of the gas tank needing to remain full. If there are only 2 gallons of gas in the tank, this constrains the choices of nodes to explore to those requiring 2 gallons of gas or less.

This is particularly true for the scenario used when generating the above graph - the constraint of the gas tank size is used to construct an "interesting" graph tand ensure that we don't end up with a graph where the traveling schoolteacher gets "stuck" somewhere without enough gas to continue. Here is the relevant section of the RandomNodeGraph.java class.

The getNextCost() method generates a random edge between two cities, with a \(\frac{T}{T+1}\) percent chance of it being impossible for the teacher to travel that route due to a gas tank that's too small:

    private static int getNextCost(int T) {
        Random r = new Random();
        return 1+r.nextInt(T);
    }

Likewise, here is the getNextPay() method, which generates a random amount of pay (in gas) that the

    private static int getNextPay(int T) {
        Random r = new Random();
        return (int)(0.5*T + 0.5*(r.nextInt(T)+1));
    }

Here is a link to the full RandomNodeGraph.java file on the charlesreid1.com git server, contained in the tsp repository (which has several codes related to the traveling salesperson problem): https://git.charlesreid1.com/charlesreid1/tsp/src/master/schoolteacher-guava/RandomNodeGraph.java

And here is a link to the tsp repository on the same charlesreid1.com git server: https://git.charlesreid1.com/charlesreid1/tsp/src/master/schoolteacher-guava

In a city with 10 routes connecting to other cities, having edges that the schoolteacher cannot travel, or nodes that limit the amount of gas the schoolteacher receives, can constrain the number of possible routes and reduce the number of routes that need to be explored. The methods above ensure that this will not happen very often, but that it will happen some of the time. These routes that can be eliminated can lead to a significant reduction in computational time.

Conclusion

This project shows how easy it is to utilize the Guava library to solve computational problems in Java and create computing benchmarks and graphs of scaling behavior. The original code to solve the traveling salesperson problem using recursive backtracking was fairly straightforward to implement on a graph, and extending this code to implement additional constraints and solve the traveling schoolteacher problem was surprisingly easy to do.

Fitting the scaling behavior to a line and computing the slope would make the scaling study more quantitative, and needs to be done, but unfortunately the Google Sheets tool does not have this capability, so this information will be done with Python (scipy linear algebra package) and comparisons between the TSP and TSTP slopes will be added later.

References

  1. "tsp (git repository)." Charles Reid. Modified 7 April 2017. Accesssed 30 April 2017. <https://git.charlesreid1.com/charlesreid1/tsp>

  2. "Solving the Traveling Salesperson Problem with Java and Guava." Charles Reid. 23 March 2017. Accessed 30 April 2017. <https://charlesreid1.github.io/solving-the-traveling-salesperson-problem-with-java-and-guava.html>

  3. "Better Timing of Guava Traveling Salesperson Problem Code: Timing Scripts." Charles Reid. 1 April 2017. Accessed 30 April 2017. <https://charlesreid1.github.io/better-timing-of-guava-traveling-salesperson-problem-code-timing-scripts.html>

Tags:    computer science    guava    graph    TSP   

March 2022

How to Read Ulysses

July 2020

Applied Gitflow

September 2019

Mocking AWS in Unit Tests

May 2018

Current Projects